


In brief
The hardware lasts longer than either side of the depreciation debate assumes. The operators have the fleet data.
A GPU’s earning power is front-loaded in a way no hyperscaler’s depreciation schedule reflects.
Hyperscaler margins are being flattered right now, but not because six years is too long.
The hardware is not the problem
Google Cloud shuts down its last P100 instances today, nine years after the chip launched. Azure retired the V100 last September at eight. CUDA 13.0 dropped Volta in August 2025, also eight years in. The K80 left both clouds at about seven. None of them retired because the chips stopped working.
The failure data says the same thing once you read it correctly. The number everyone quotes is from Meta’s Llama 3 paper: 419 unplanned stoppages in 54 days on 16,384 H100s, 148 from faulty GPUs and 72 from HBM3. That annualizes to about nine events per hundred cards and gets repeated as a 9% failure rate. It isn’t. Meta counted job interruptions, not card replacements, and most GPU memory errors resolve with a row remap and a restart. The replacement data comes from NCSA’s Delta cluster: 448 A100s over 895 days and 608 H100s over 146 days, six cards physically replaced in total. That is 0.36% a year for A100 and 0.82% for H100. Oak Ridge ran 27,756 V100s at over 80% utilization for five and a half years and 0.4% of them ever threw a double-bit error.
The “one to three years at high utilization” claim traces to a single 2024 post quoting an unnamed Alphabet architect. Alphabet’s actual infrastructure lead said last October that seven- and eight-year-old TPUs run at full utilization. NVIDIA’s CFO says the same about the A100. The bears are starting from a number the operators have disproved.
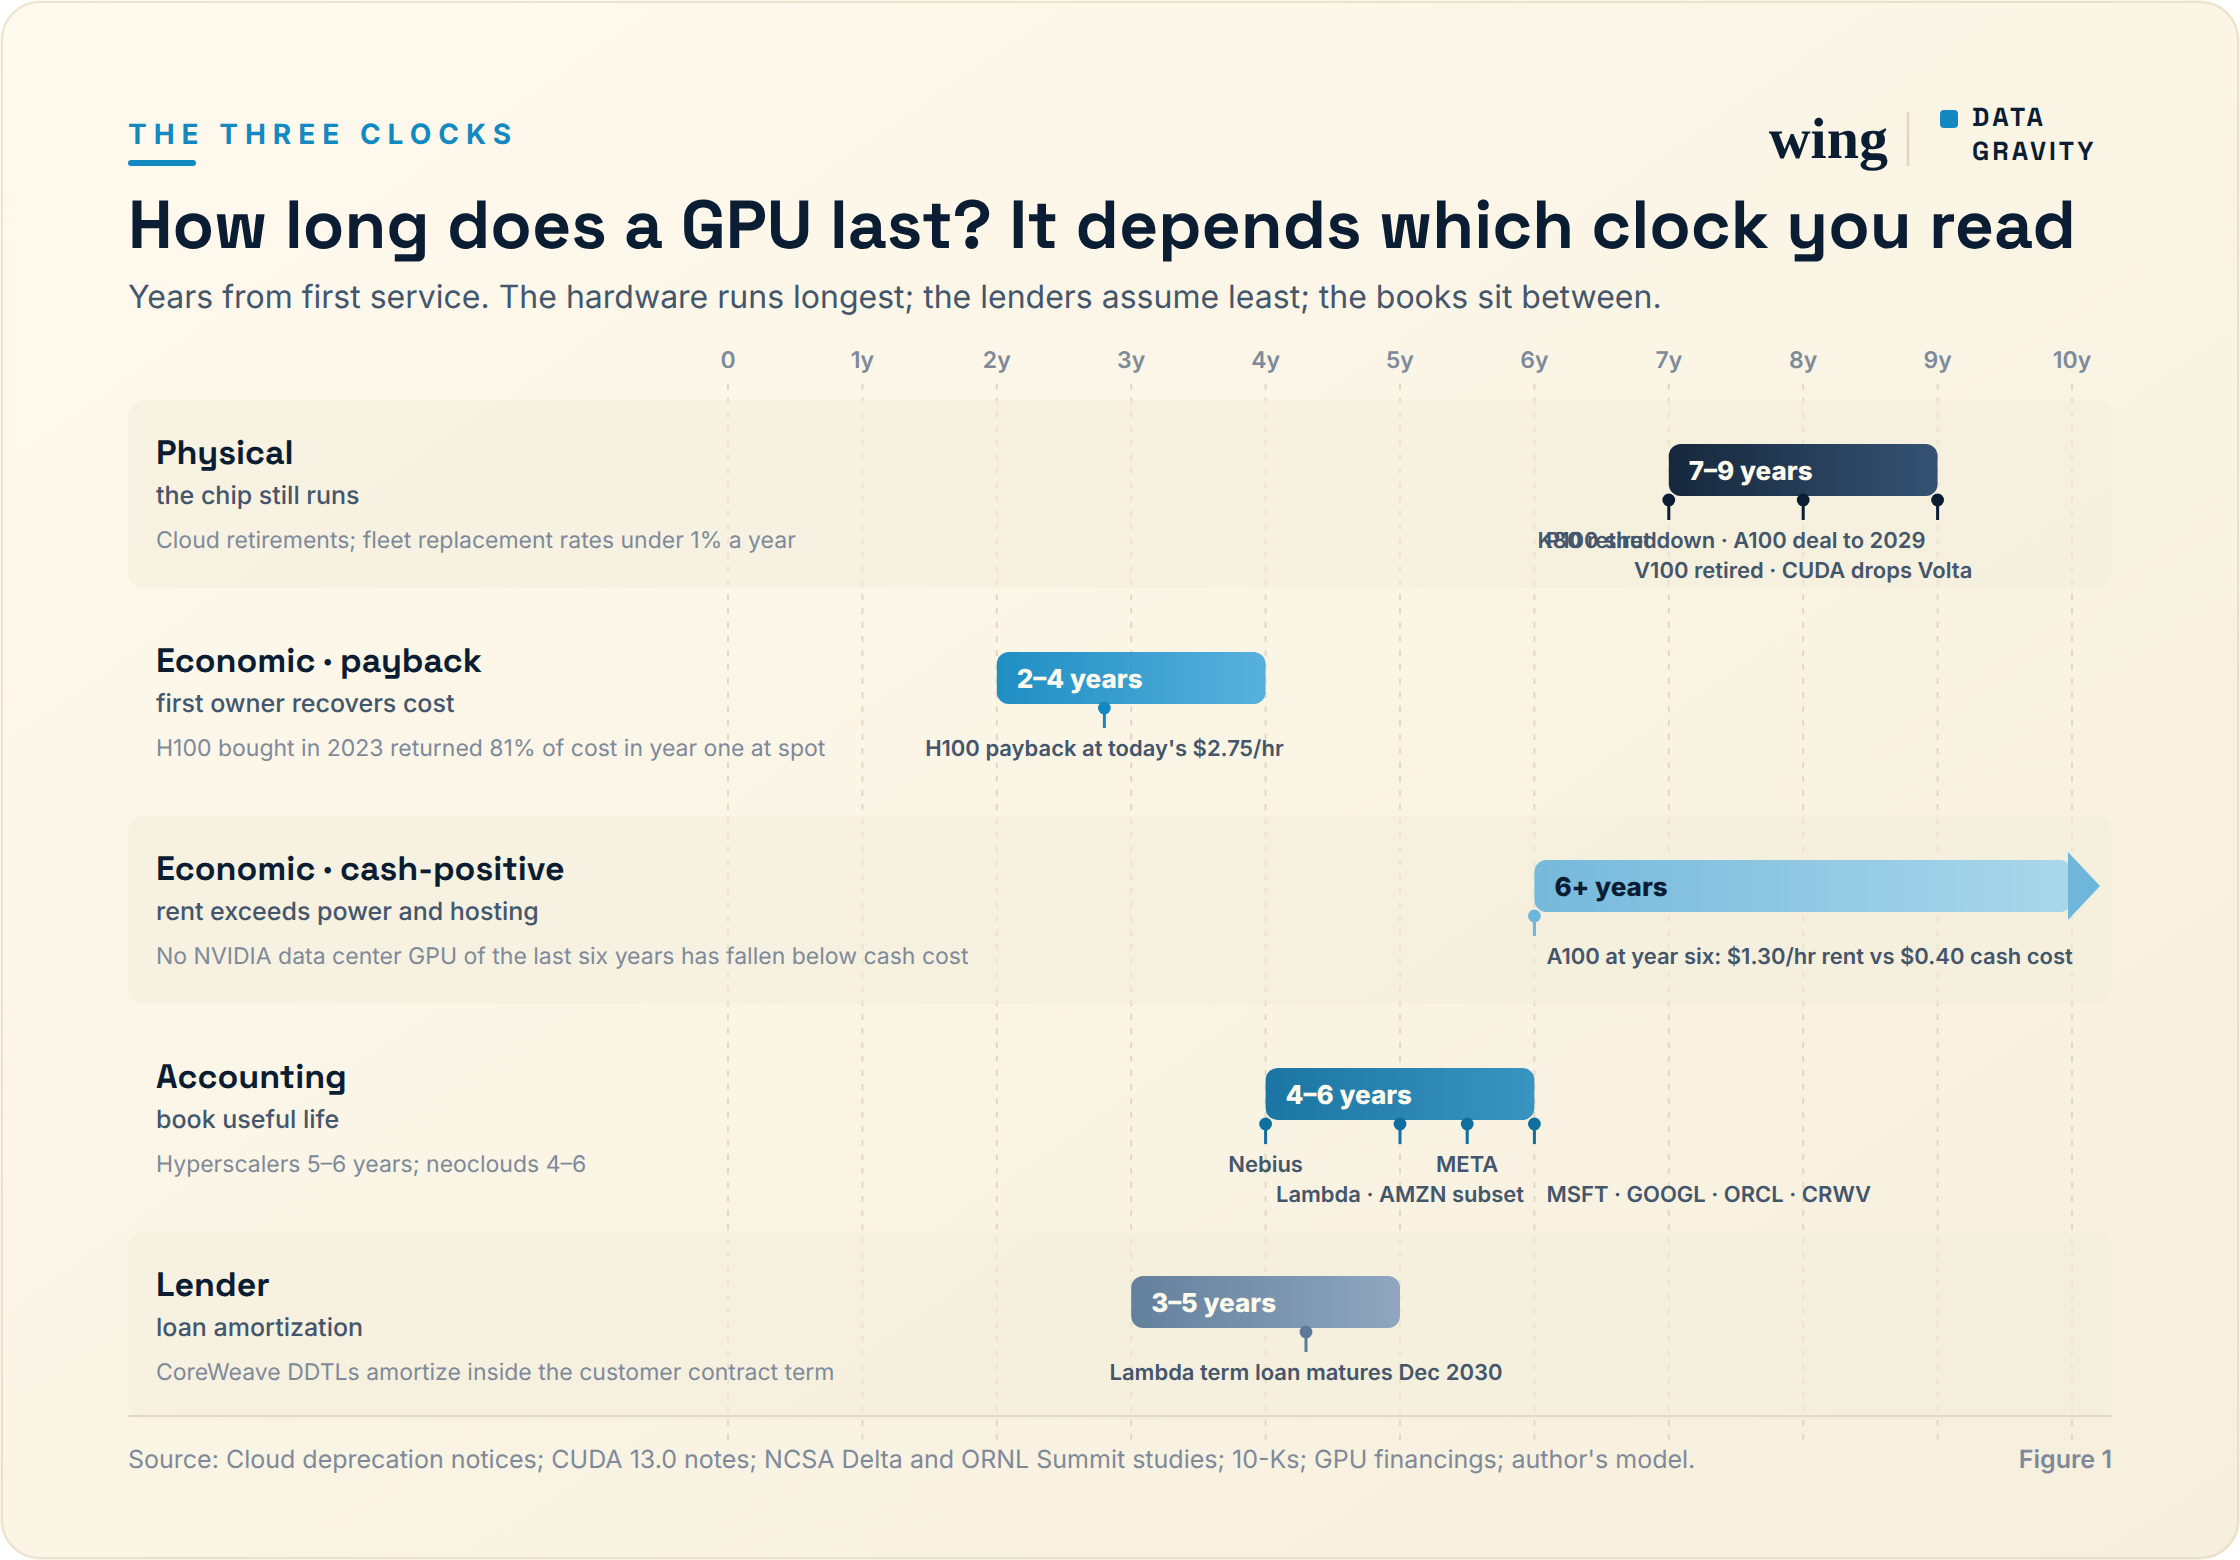
Three clocks on one asset: how long a GPU runs, how long it takes to pay back, and how long the books say it lasts.
What actually depreciates is the rent
An H100 rented for more than $8 an hour in the summer of 2023. SemiAnalysis’s spot composite fell to $4.77 by mid-2024 and $3.60 by early 2025; one-year contracts bottomed at $1.70 in October 2025. Then it reversed. One-year contracts were $2.35 by March, up 38% in five months, on-demand capacity sold out, and CoreWeave reported prices rising on A100s, H100s and H200s in the same quarter. The spot index settled at $2.75 on September 14.
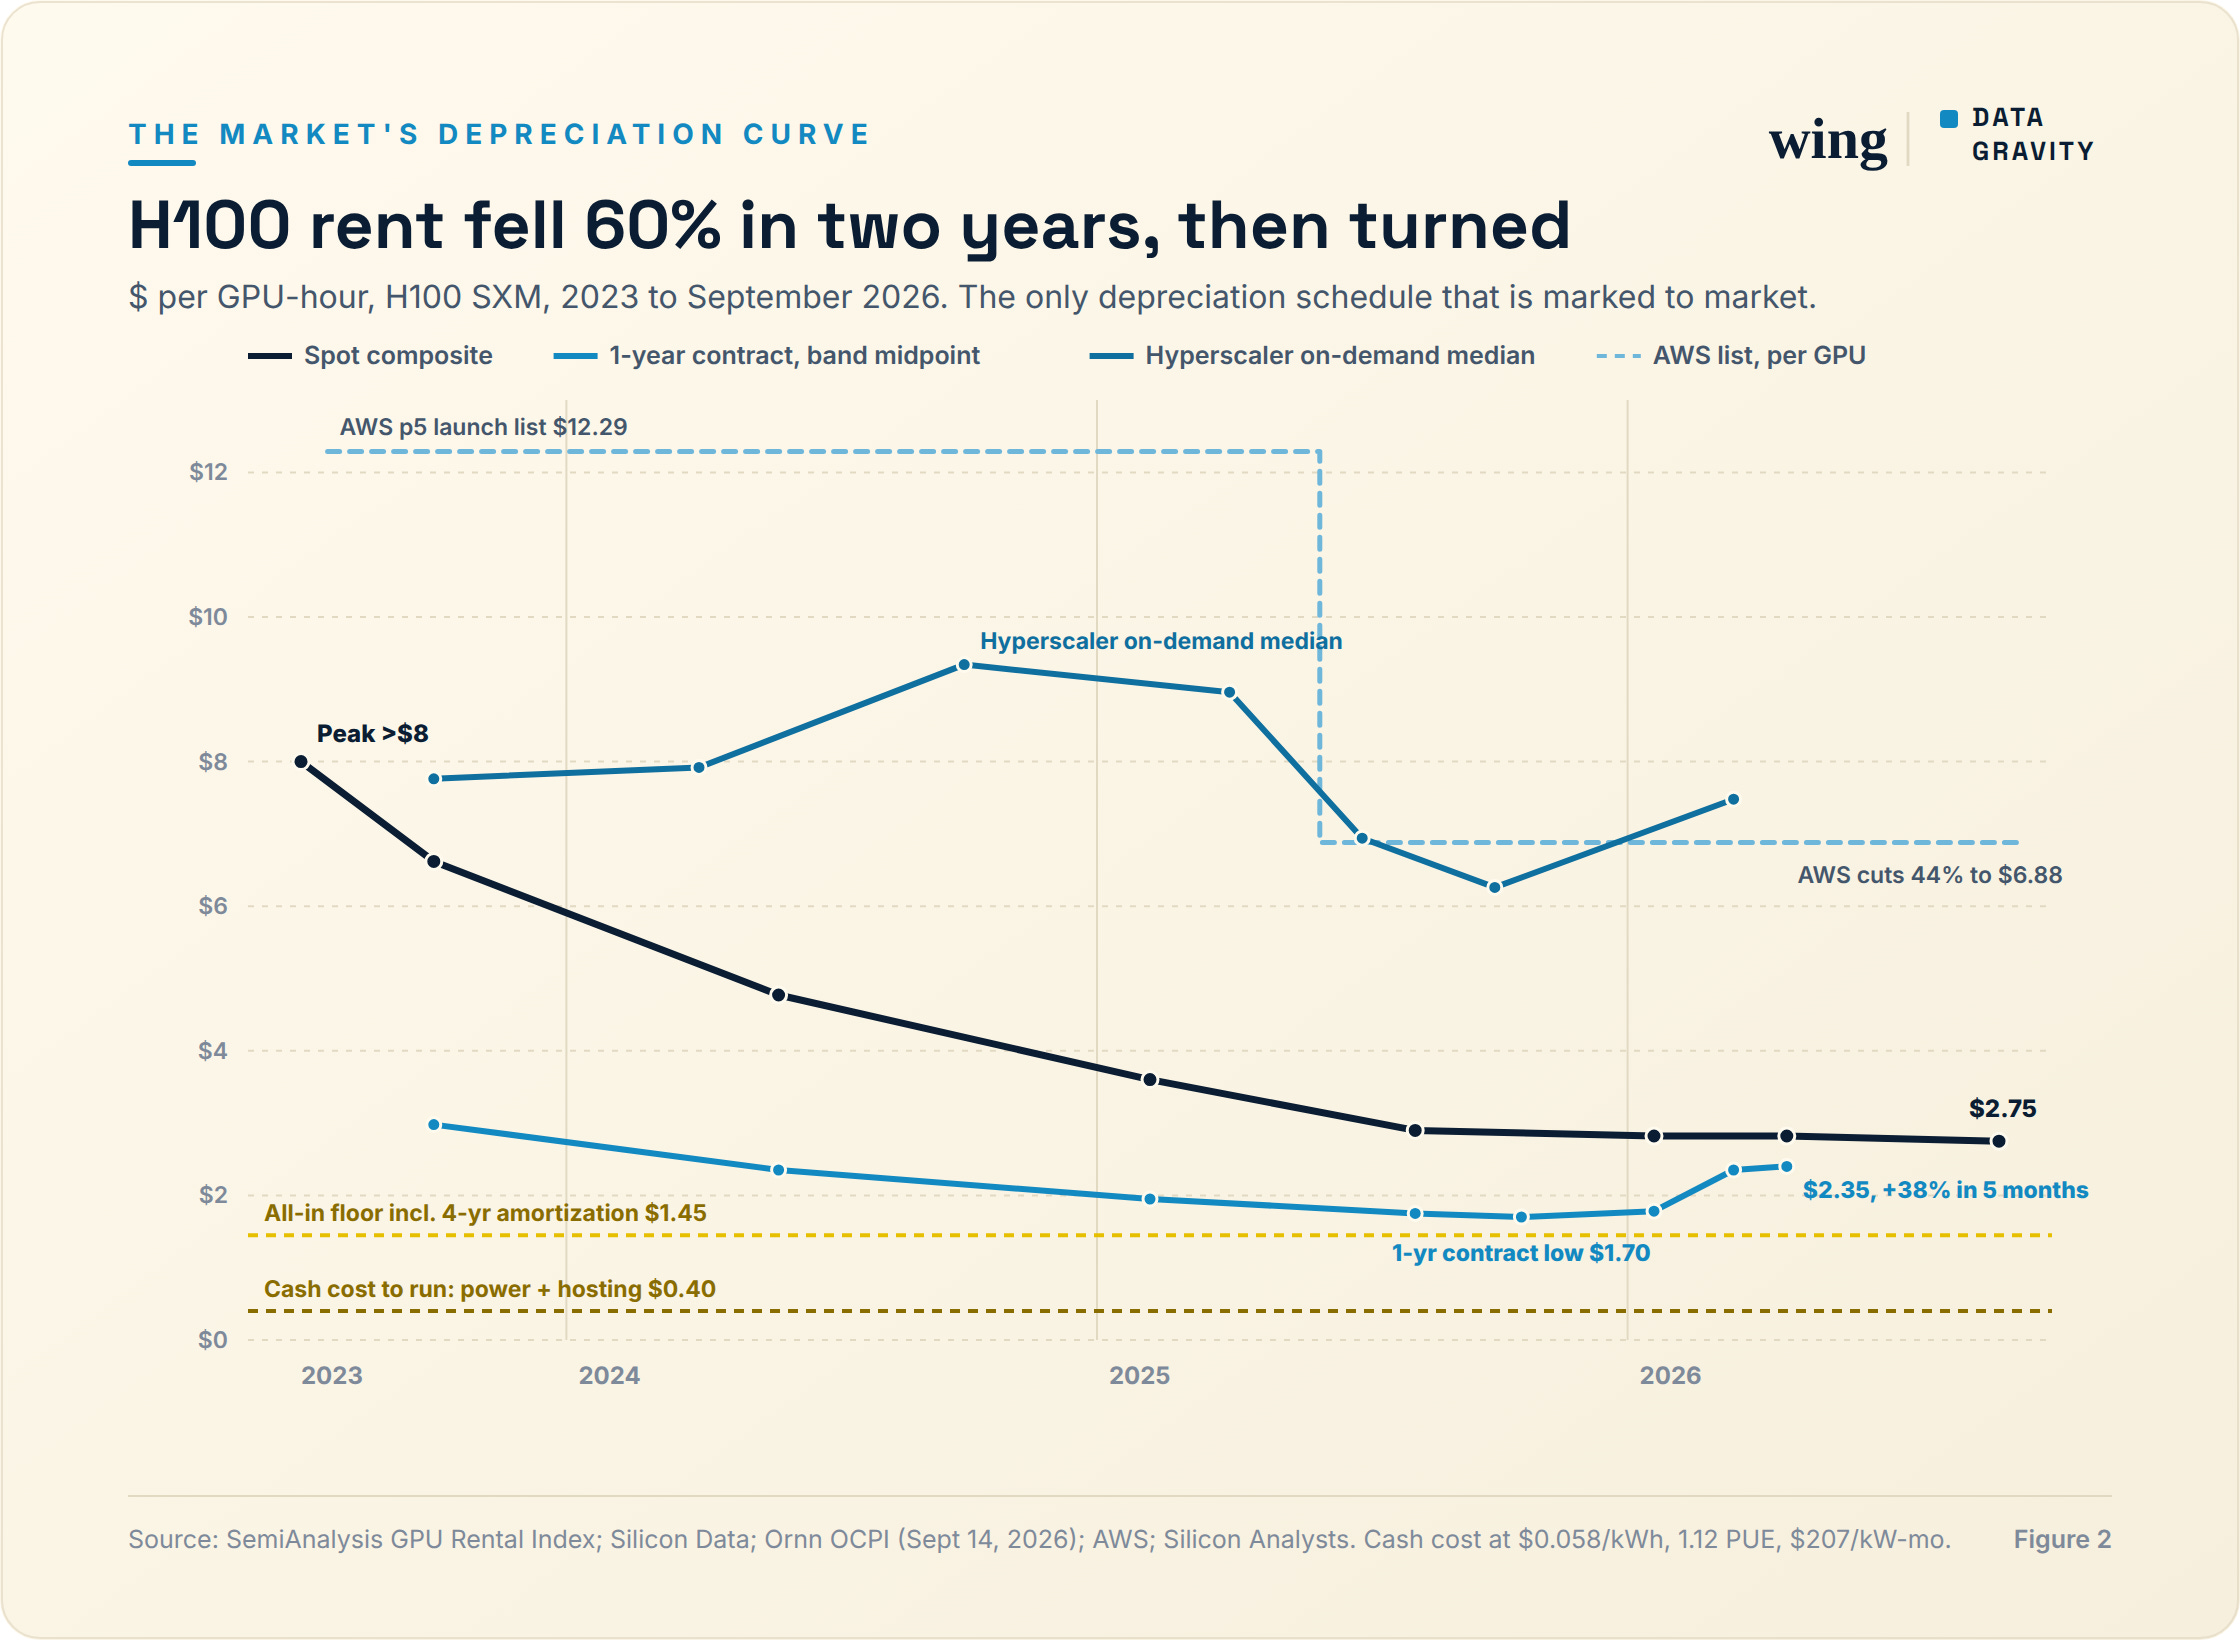
H100 rental price per GPU-hour, 2023 to 2026: spot, one-year contracts, hyperscaler list, and the cash cost of keeping one running.
The A100 is the completed experiment. AWS launched it at $4.10 an hour in 2020. Six years later it trades at $1.02 to $1.58, an 18% annual decline. But the cash cost of keeping one running is about $0.40 an hour, $0.05 of power and $0.36 of colocation, so a six-year-old A100 still earns three times its operating cost on hardware that paid for itself years ago. That is why CoreWeave could sign an A100 contract in August that runs to 2029, and why “GPUs last three years” and “A100s are fully utilized” are both true. The chip is fine. The rent it commands is what decays.
The money arrives early
Take an H100 bought in the second half of 2023 at $40,000 all-in, which is the GPU plus its share of server, network and storage. Run it 6,132 hours a year, 70% utilization. Charge it $0.40 an hour in cash cost. Rent it at the spot rates that actually prevailed.
Year one nets $32,500. Year two, $17,800. Year three, $14,700. Assume years four through six at today’s $2.35 contract rate and each nets about $12,000. The six-year total is roughly $101,000, and half of it arrived in the first two years.
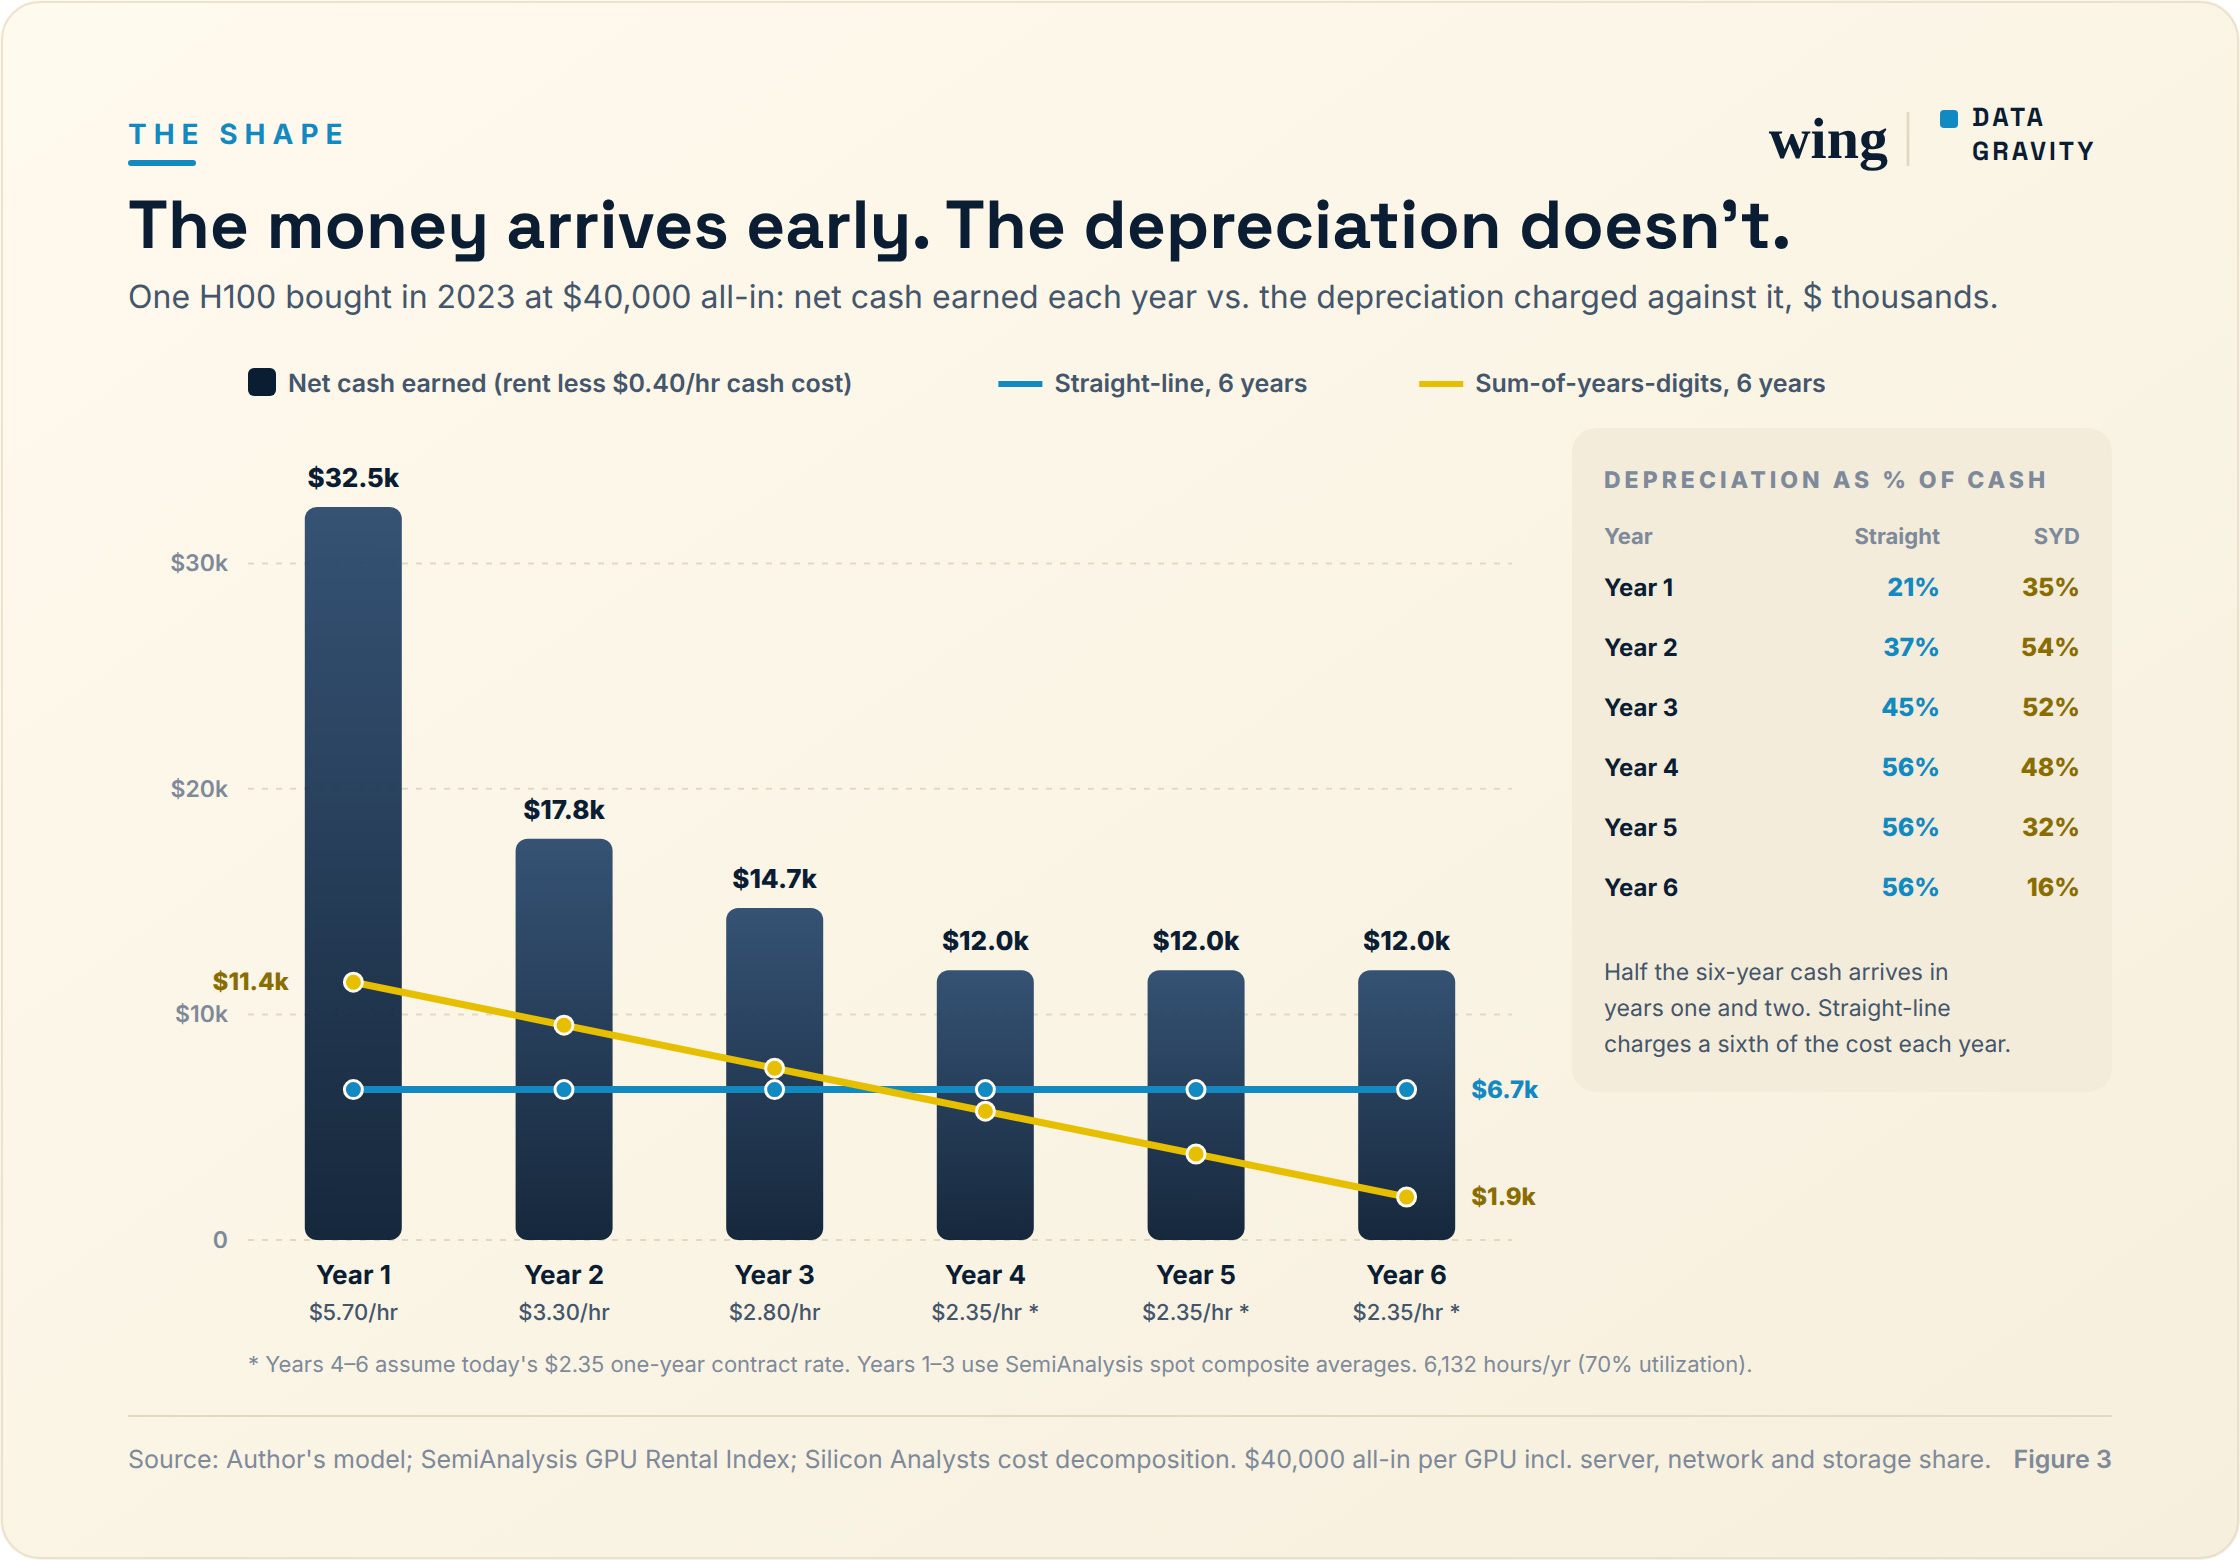
Straight-line depreciation on that asset is $6,667 a year, every year. In year one that is 21% of the cash the GPU generated. In year six it is 56%. Reported profit on the same card falls from $25,800 to $5,300 while the card does nothing different except get cheaper to rent. Sum-of-years-digits, which every accounting textbook offers for exactly this kind of asset, charges $11,400 in year one and $1,900 in year six and tracks the cash within a few points the whole way. Nobody in this industry uses it.
Other industries that rent out depreciating hardware do. Rental-car companies set depreciation from the used-car market and revise it quarterly; Hertz took a $245M charge in late 2023 when EV resale values fell. GPU owners have a rental index and a resale market too. Neither appears in a depreciation schedule. The lenders are the exception: GPU-backed loans amortize over three to five years, inside the customer contract, which is to say the people whose money is actually at risk already depreciate the way the cash arrives.
This is not a complaint about six years. The lifetime charge is the same $40,000 either way. It is a complaint about timing, and for companies valued on current margins, timing is the whole game.
Why it matters now
A straight line on a front-loaded asset would wash out in a steady-state fleet, with as many six-year-old cards as one-year-old ones. This fleet is nothing like steady state. The four largest buyers guided to about $670B of 2026 capex against roughly $380B in 2025 and $230B in 2024. When the base grows 50% a year, 61% of installed cards are two years old or younger and the average card is under two. At zero growth those figures would be 33% and three years.
Run the cohort model across a whole fleet and the effect has a number. At 75% annual growth in the installed base, straight-line depreciation is 29% of the fleet’s net cash. At 50% it is 31%. Flat, it is 40%. Sum-of-years-digits sits at 40 to 41% at every growth rate, because it charges each cohort roughly in proportion to what it earns. Straight-line turns GPU-level margin into a function of the capex growth rate: about ten points of margin that arrive with growth and leave with it, with no change in policy and no chip failing.
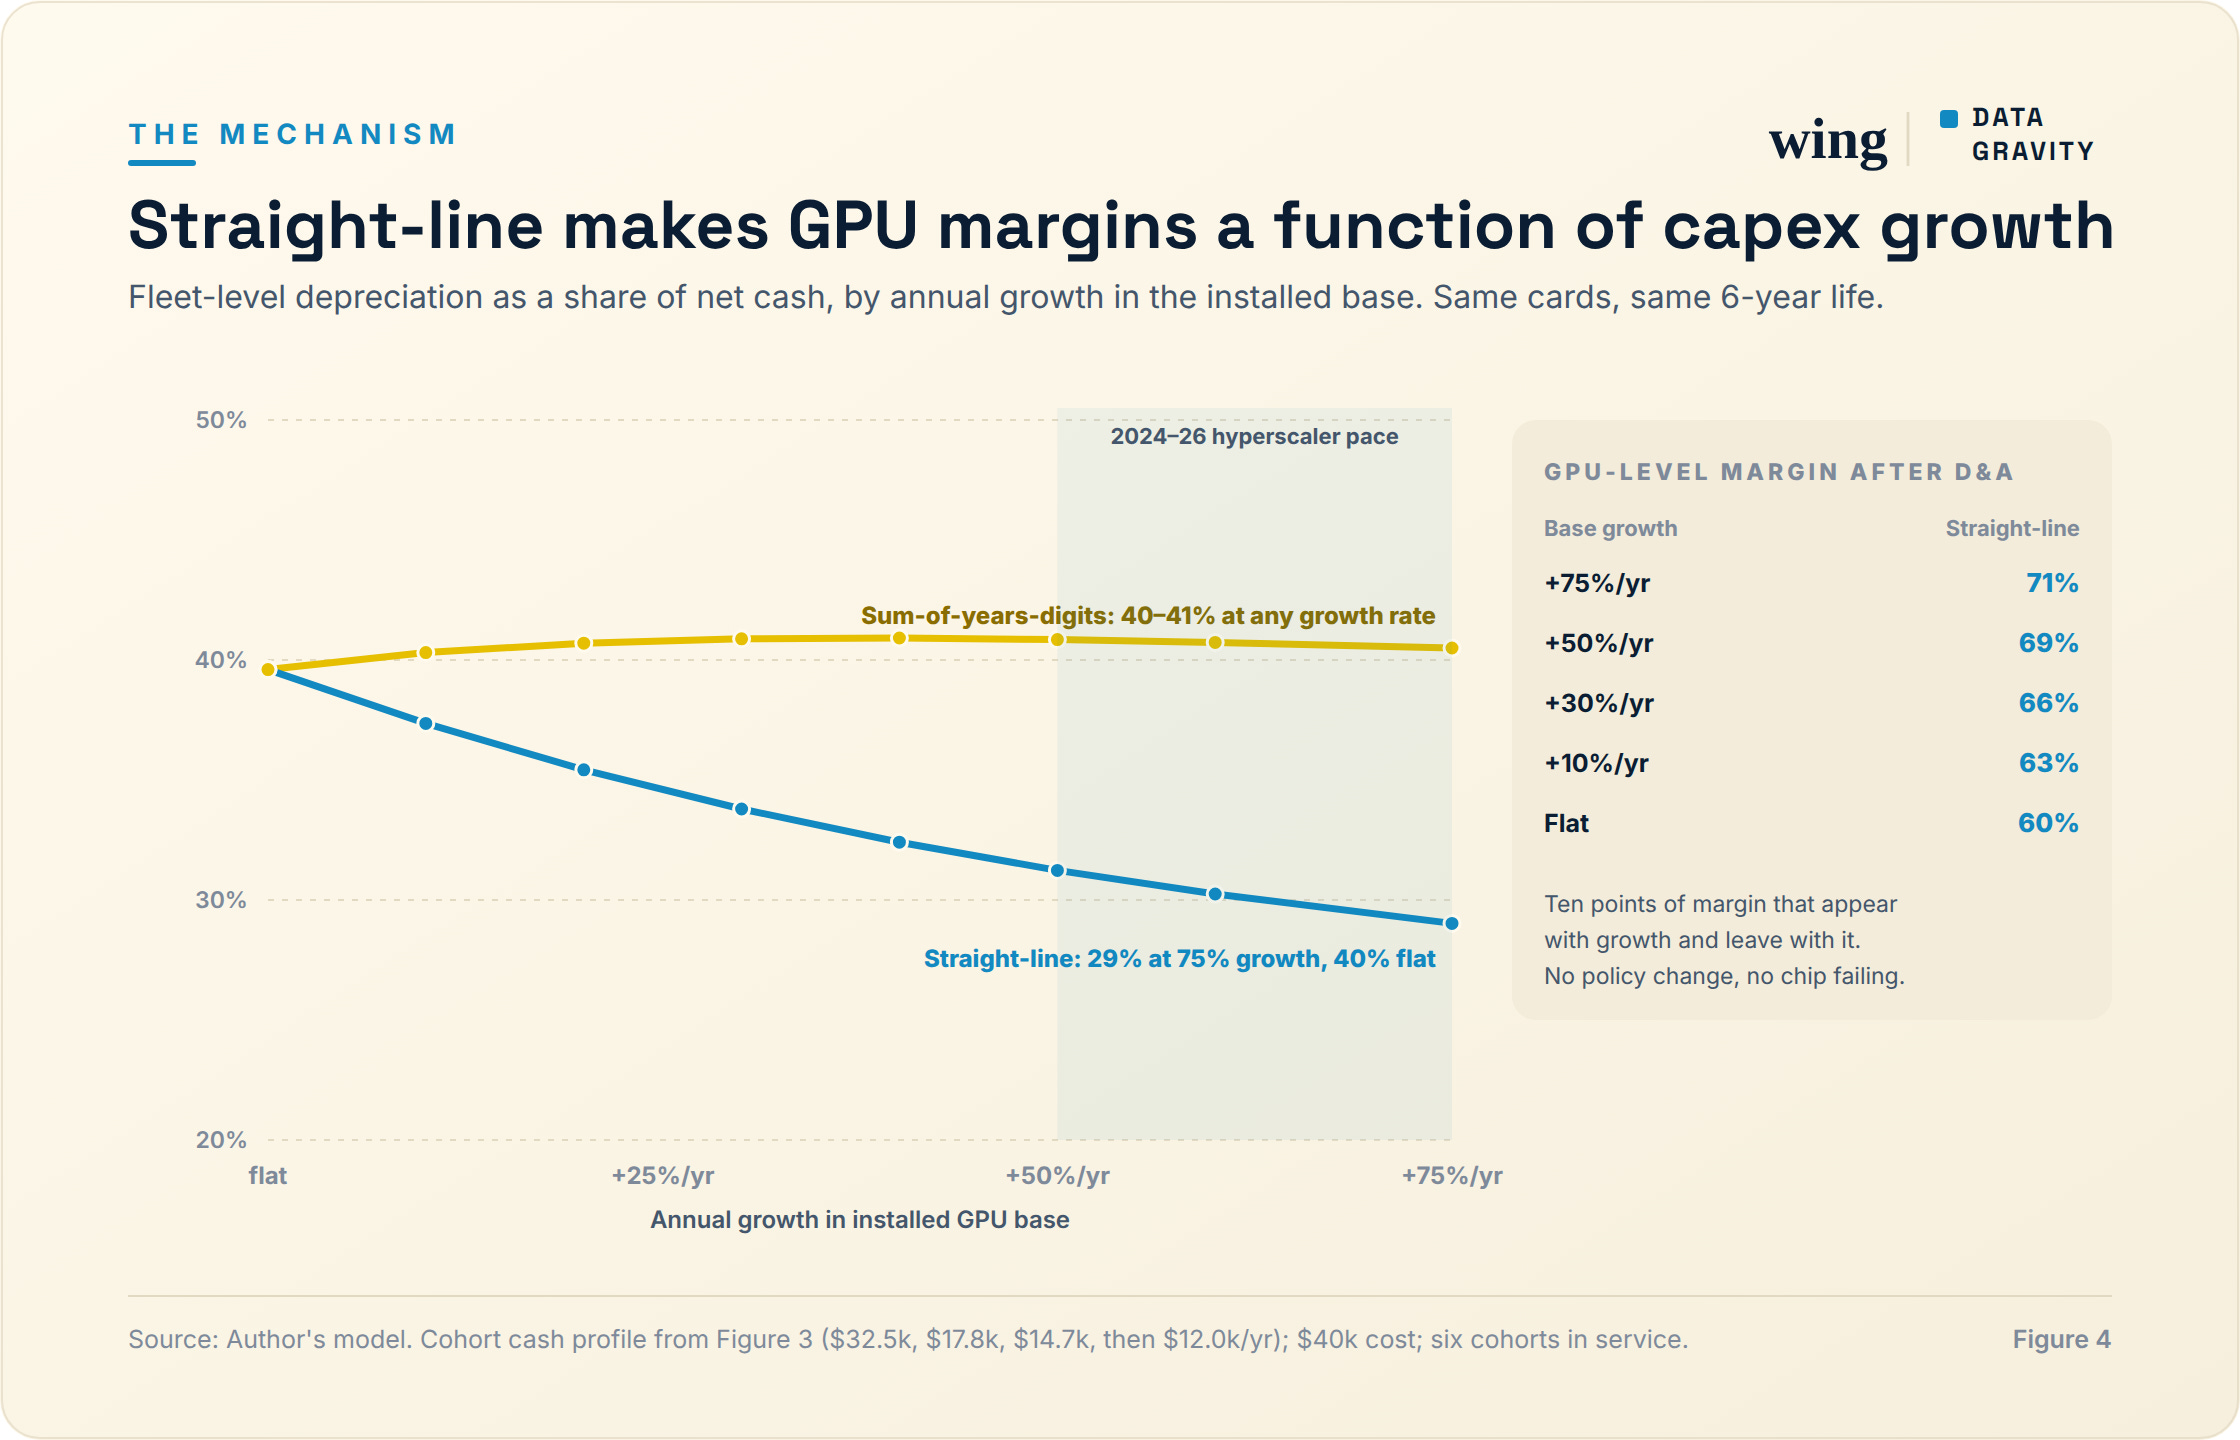
Fleet-level depreciation as a share of net cash, by annual growth in the installed base. Straight-line moves with growth; sum-of-years-digits does not.
Distillate Capital measured the same effect from the other side: hyperscaler depreciation ran around 80% of capex for most of the last decade and is now under 40%. That gap gets read as evidence that lives are too long. Mostly it is evidence that the fleet is young. The two look identical on an income statement and mean opposite things about the future.
When capex growth slows, the fleet ages into the years where the straight line overstates the charge, and margins compress on their own. Amazon’s 2025 move of a subset of servers from six years back to five, the only shortening any large buyer has made, adjusted length. It did not touch shape.
What a year is worth
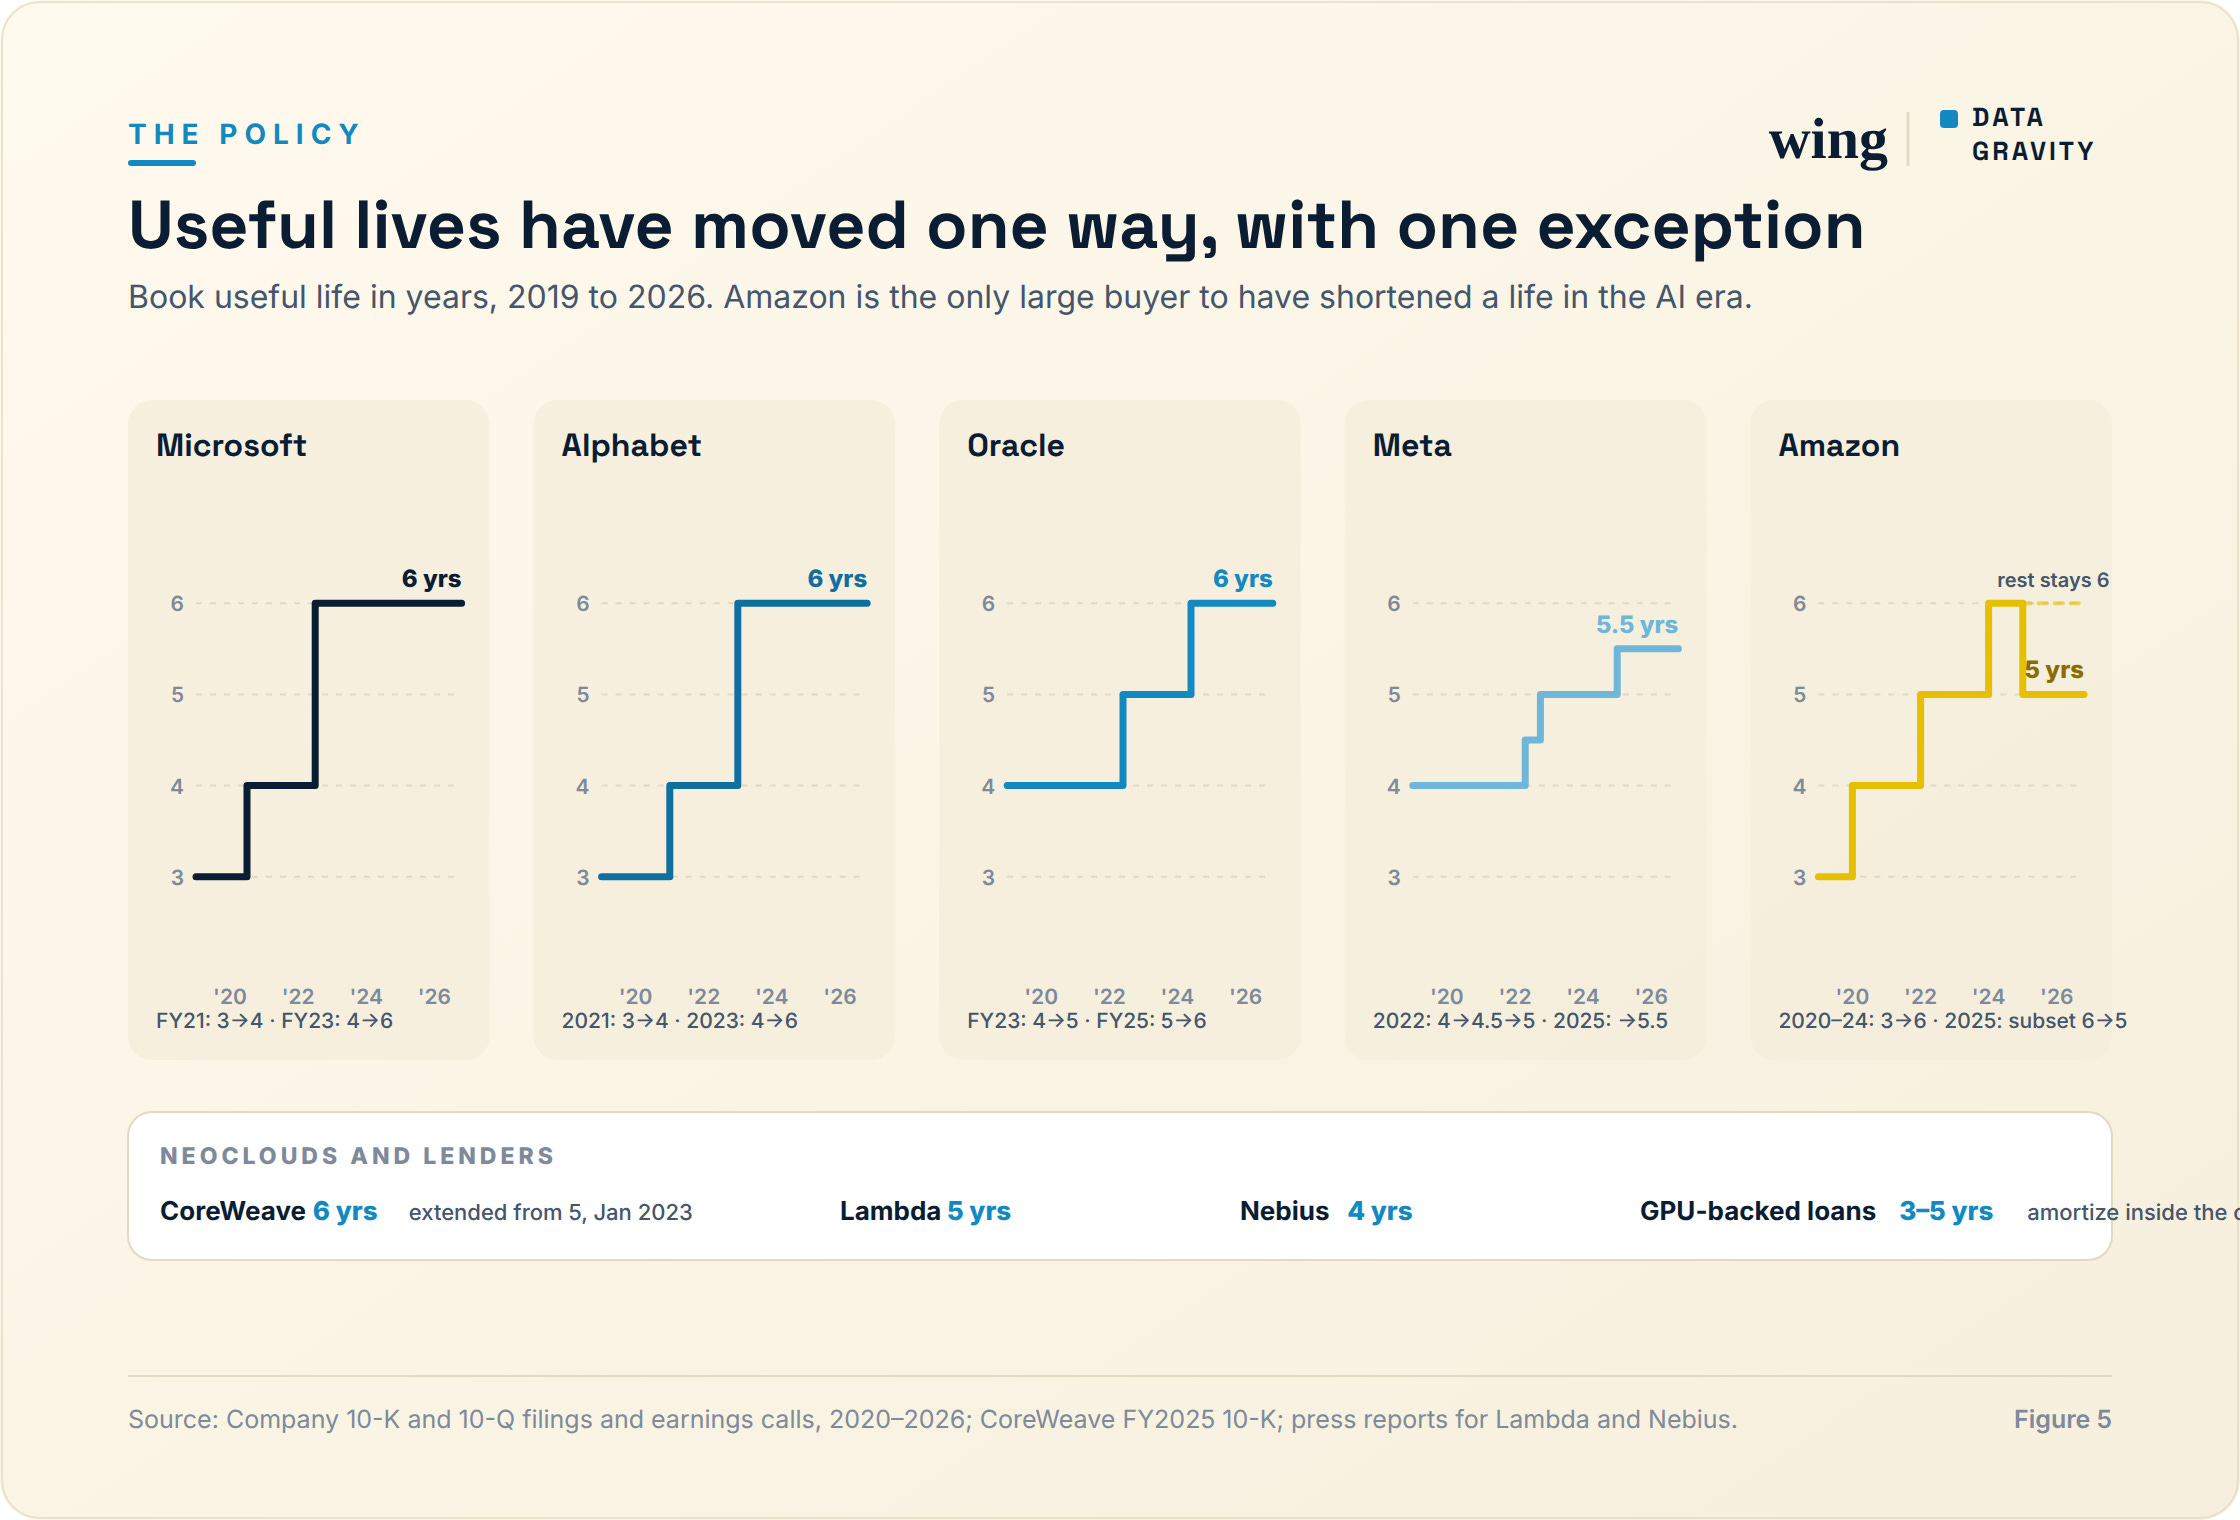
Server useful lives at the five largest AI buyers and three neoclouds, 2019 to 2026.
Every large buyer has extended at least twice since 2020. Microsoft’s move from four to six years added $3.7B to fiscal 2023 operating income; Alphabet’s cut $3.9B the same year; Meta’s extension to 5.5 years in January 2025 was worth $2.9B. Microsoft’s CFO put the current policy plainly in January: two-thirds of capex is short-lived assets, mostly GPUs, depreciated over six years, and the capacity is “already sold for the entirety of their useful life.”
The bear case, as Michael Burry framed it last November, is that a two-to-three-year product cycle cannot support a six-year book life and that the large buyers will understate depreciation by $176B across 2026 to 2028. JPMorgan Asset Management ran the cleanest version of that sensitivity in January: restate all GPU and networking capex since 2023 on a three-year life and 2025 EPS falls 7% at Amazon, Meta and Microsoft, 6% at Alphabet, 17% at Oracle. On the 2026 server cohort alone, roughly $425B, a three-year life charges $142B a year against $71B at six.
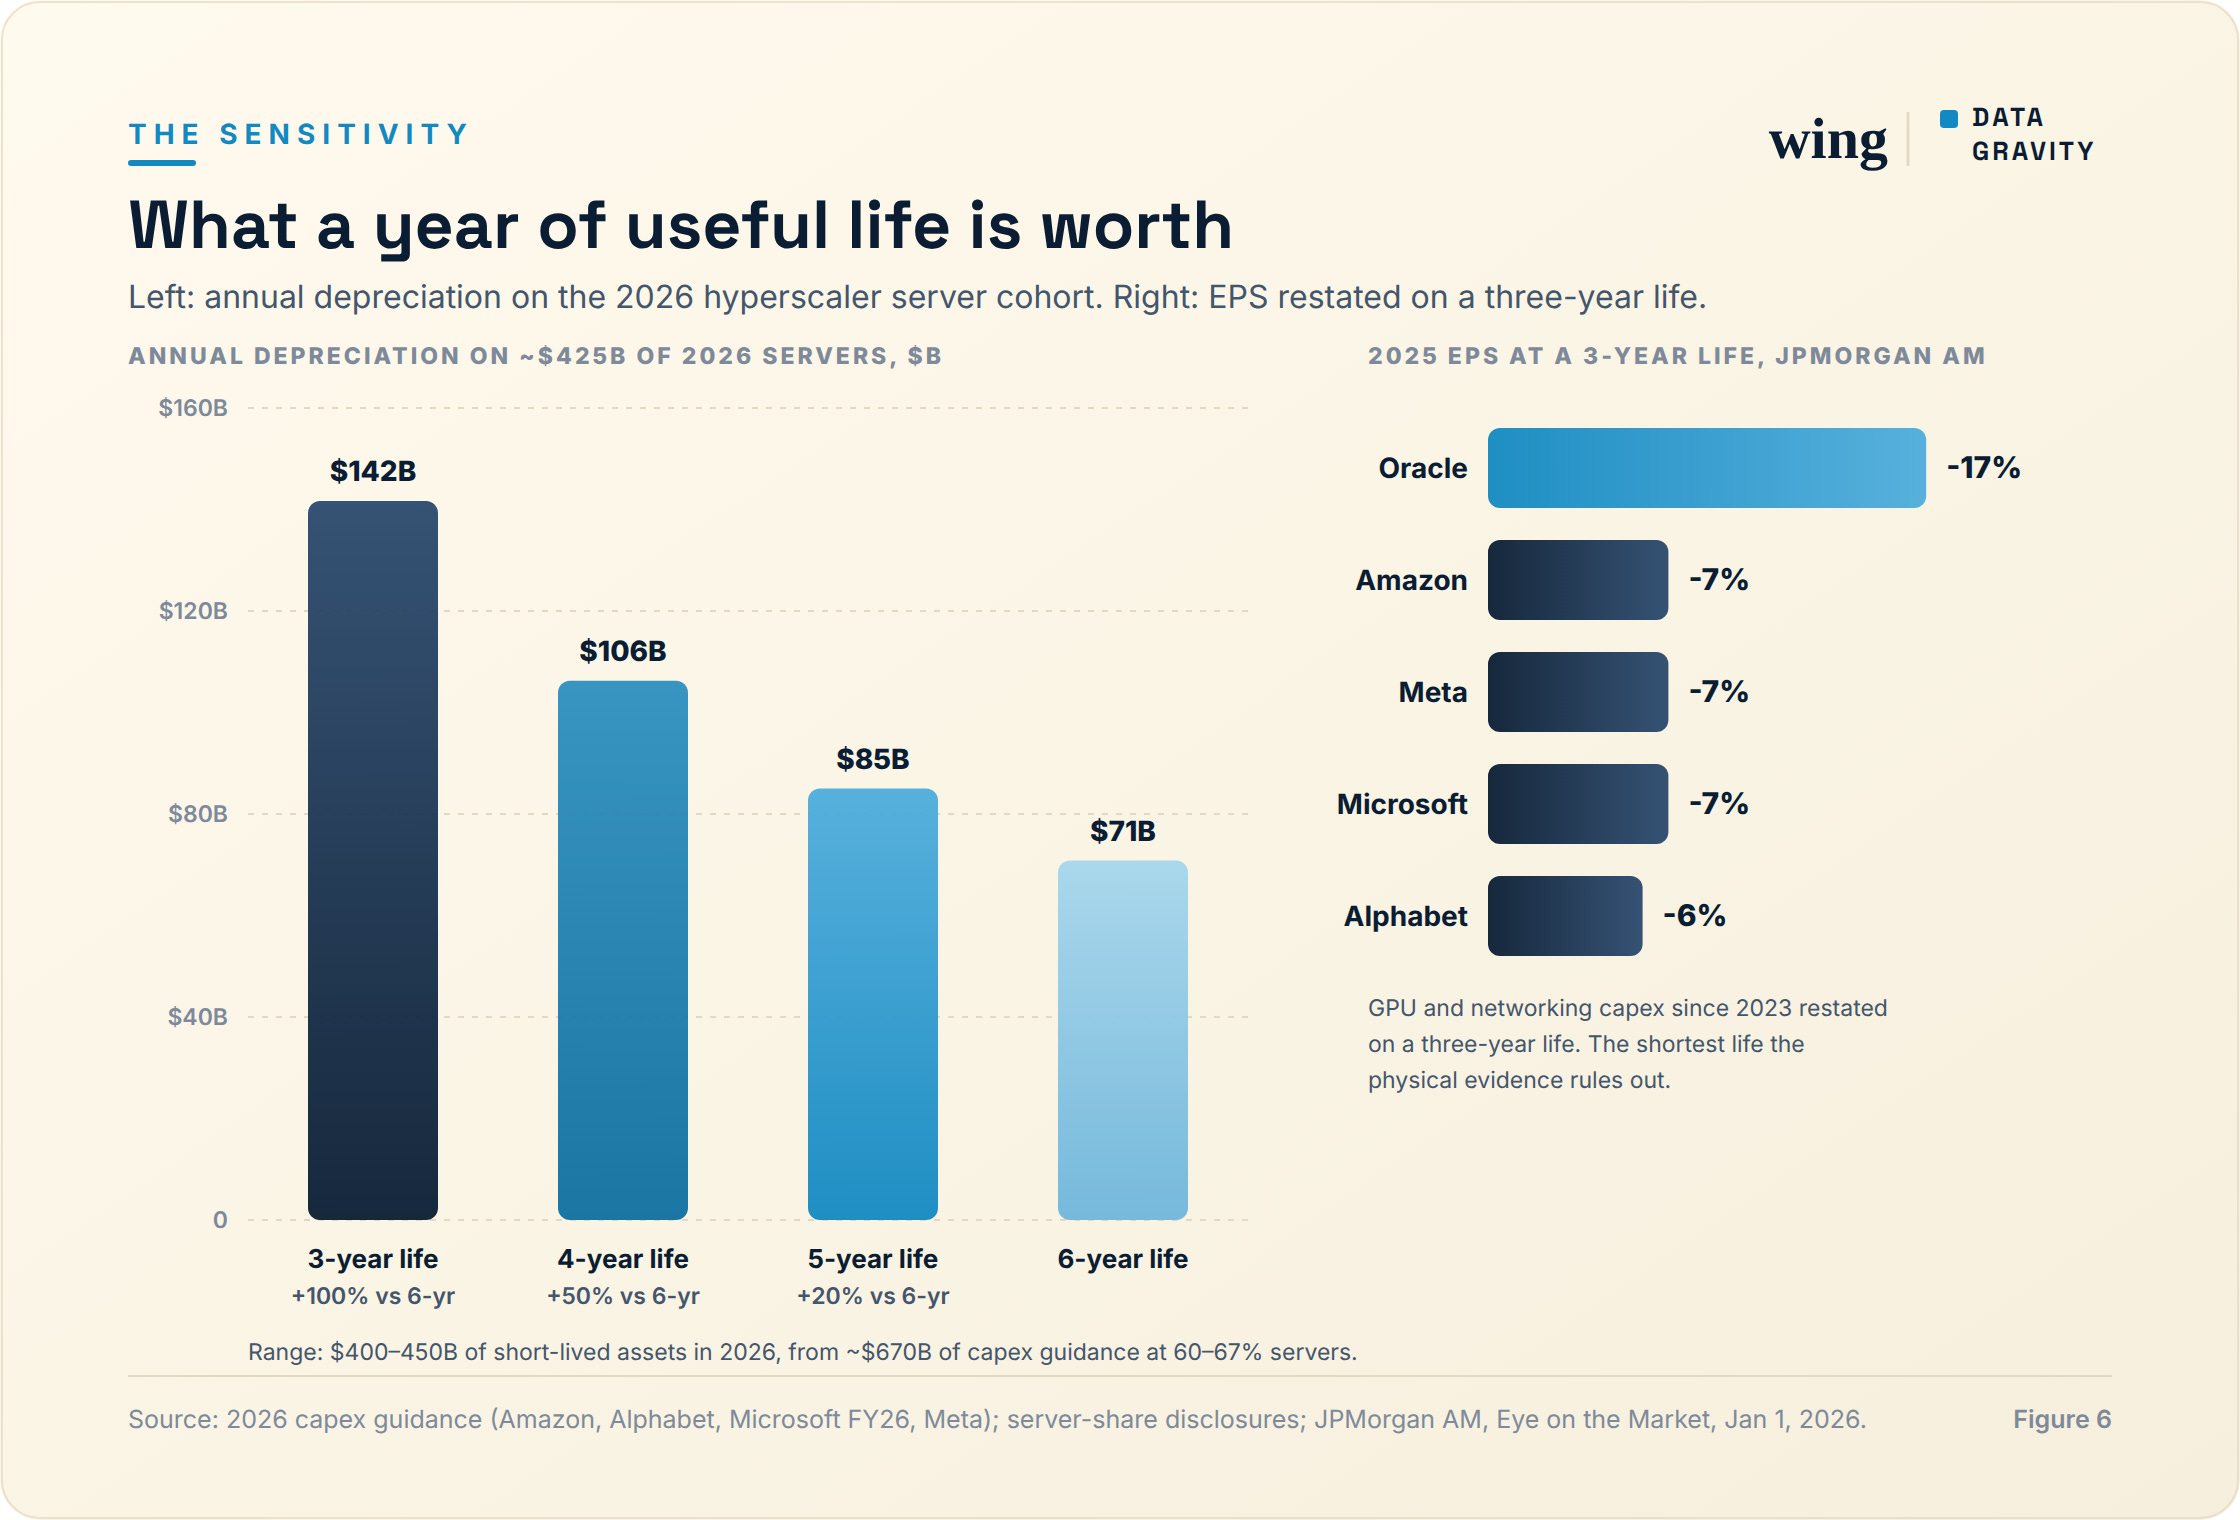
Annual depreciation on the 2026 hyperscaler server cohort at three- to six-year lives, and the EPS effect of a three-year life by company.
Those are the stakes if you accept the premise. I don’t. The fleet data rules out three years as a general physical or revenue-producing life. Three years may well describe how long a card stays competitive for frontier training, but that is a different clock, and the point of this piece is that the clocks differ. A reader who stops at “three years is wrong” and concludes the accounting is fine has still missed the part that matters. A six-year straight line is defensible on length and mismatched on shape, and the timing gap is widest at exactly this moment, when the fleet is youngest and the capex curve steepest.
The wrong variable
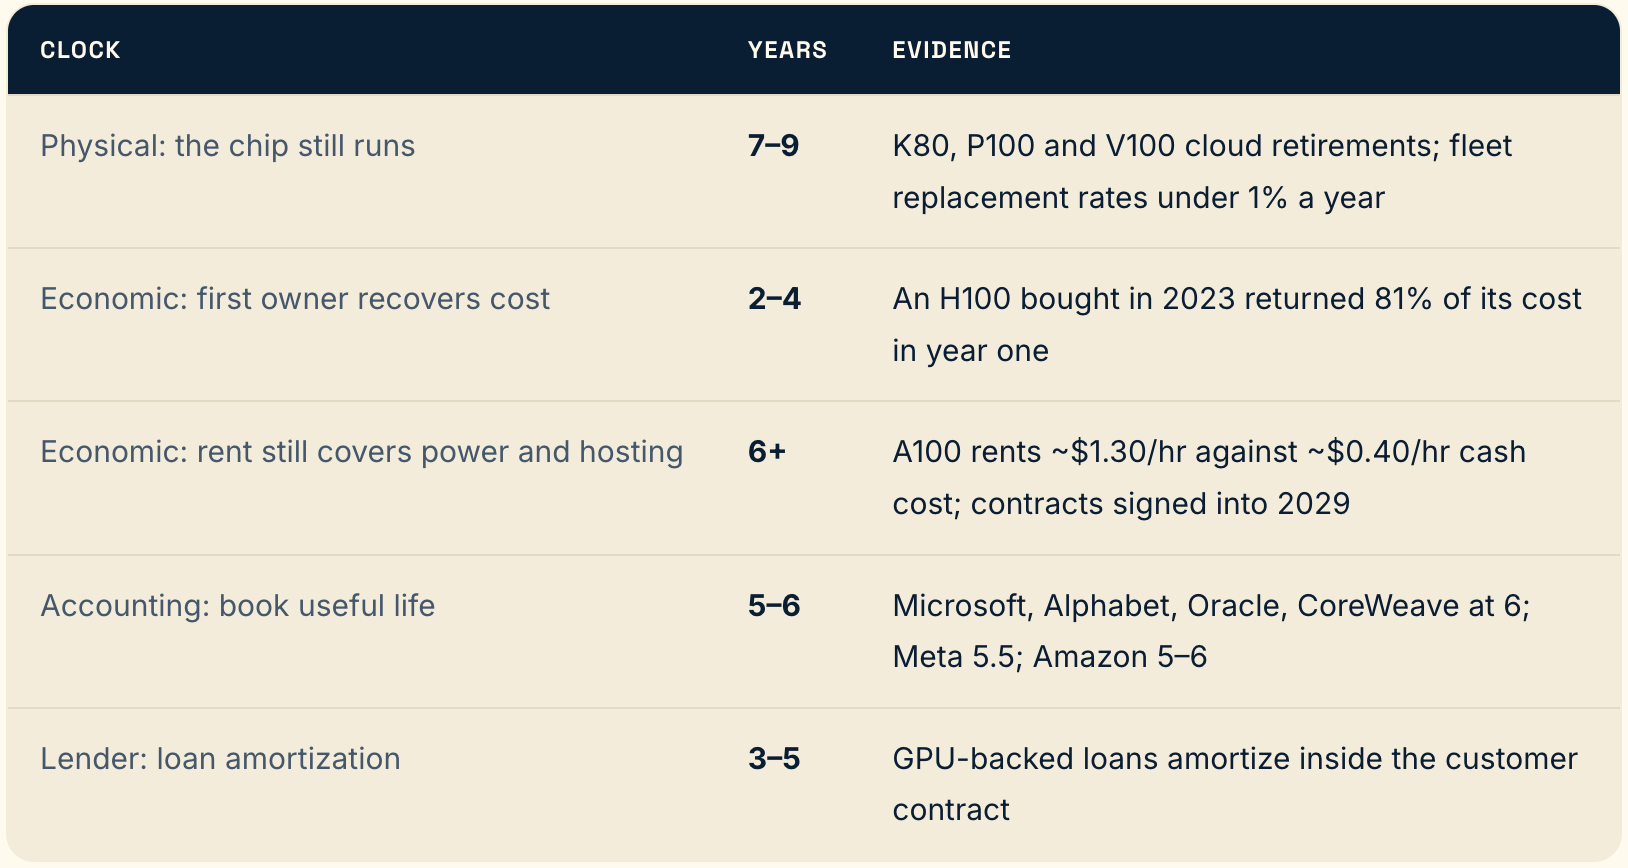
The GPU depreciation debate is being argued as a question of length, and length is the part the evidence has already settled. Seven to nine years physically. Six on the books. Two to four to pay back. Those are consistent with each other.
What is not settled, and not disclosed, is shape. The hardware earns half its lifetime cash in its first two years and is depreciated as if it earned a sixth in each. None of that is improper accounting. Straight-line is permitted, disclosed and consistently applied, and over six years it charges exactly what the card cost. What it does is move recognition: on a fleet growing 50% a year, it books less depreciation than the cash profile would in every quarter, and the year the buildout slows it books more. The bears have the right instinct about flattered margins and the wrong mechanism. It isn’t that the chips die early. It’s that the money shows up early and the accounting spreads it out.