

Inference Economics 101: Reserved Compute versus Inference APIs
How utilization, performance diffusion, and deployment tradeoffs determine where durable value accumulates as AI inference scales from experimentation to production

As AI inference moves from experimentation to production, the infrastructure layer is no longer converging on a single “best” model. Instead, it is bifurcating into two durable and economically attractive markets, each optimized for a different constraint.
On one side are reserved and hourly compute platforms, designed to deliver predictability, control, and determinism for customers willing to operate infrastructure directly.
On the other are inference APIs, which trade some control for scale, absorbing utilization risk and abstracting complexity in exchange for cost efficiency and speed.
Understanding this split—and the tradeoffs it implies around utilization, performance, and deployment—is essential to evaluating where value will accrue as inference becomes ubiquitous.
Reserved Compute Platforms vs Inference APIs: Two Attractive Markets with Different Strengths
The AI infrastructure market is bifurcating into two durable and attractive segments, each optimized for different customer priorities and economic tradeoffs:
Reserved / hourly compute platforms optimize for predictability and control
Inference APIs optimize for utilization efficiency and cost abstraction
Neither is categorically superior; each wins in a different region of the workload and buyer space.
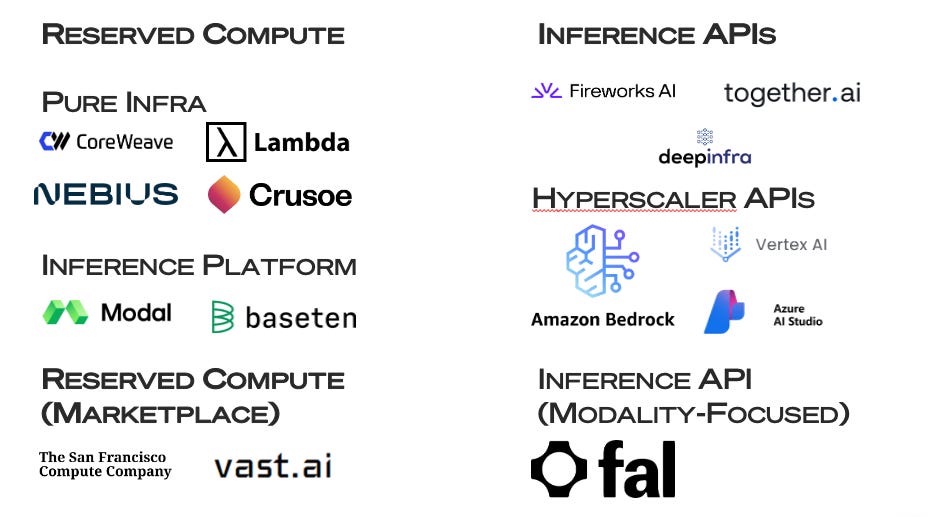
1) Reserved / Hourly Compute Platforms: Predictability and Control
Compute platforms offering hourly or reserved GPU instances (e.g., SF Compute, Modal–style offerings) are attractive because they deliver determinism.
What customers are buying
Guaranteed access to scarce GPUs
Predictable performance and capacity
Full control over the runtime and stack
Clear, stable unit economics (GPU-hours)
Why this is valuable
Many workloads require consistency more than elasticity
Teams want to size infrastructure once and operate against it
Enterprises value control, compliance, and reproducibility
Economic profile
High utilization per customer when workloads are well sized
Revenue tied to long-lived contracts or reservations
Smaller number of customers, but:
Larger ACVs
Lower churn
Clear capacity planning
Tradeoff
Limited aggregation across customers
Growth scales linearly with GPU fleet expansion
TAM constrained by customers willing to operate infrastructure
This model resembles:
Early AWS EC2 reserved instances, CoreWeave-style compute, or traditional hosting—capital intensive, but predictable.
2) Inference APIs: Utilization, Cost Abstraction, and Scale
Inference APIs are attractive for the opposite reason: they absorb complexity and utilization risk on behalf of customers.
What customers are buying
Tokens or requests, not hardware
Elastic capacity without provisioning
Built-in batching, routing, and scaling
Operational simplicity and fast time-to-production
Why this is valuable
Most inference workloads are bursty and uneven
Most teams do not want to manage GPU fleets
Cost predictability at the application level matters more than raw unit cost
Economic profile
Lower utilization per customer
Higher utilization at the platform level via aggregation
Revenue scales with:
Number of customers
Number of use cases per customer
Overall inference volume
Tradeoff
Less deterministic per-request performance
More exposure to price compression at the execution layer
Requires sophisticated systems to maintain margins
This model resembles:
Stripe, Twilio, or Datadog—abstracting infrastructure into a product.
3) The Core Tradeoff: Predictability vs Aggregation
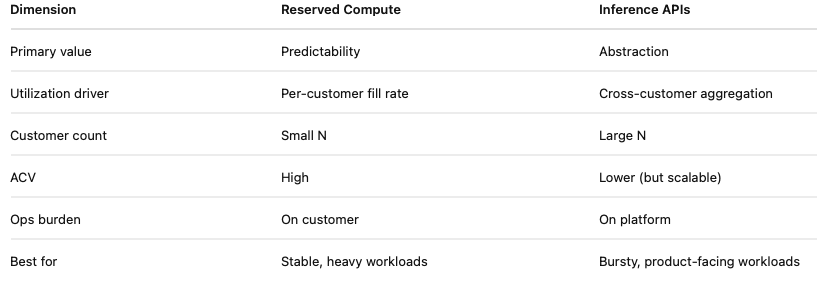
Key insight
Reserved compute platforms win by making one customer predictable.
Inference APIs win by making many customers efficient together.
4) Why Both Markets Remain Attractive Long-Term
AI workloads are diversifying, not converging
Some buyers will always prioritize control and determinism
Others will always prioritize speed, elasticity, and simplicity
As a result:
Reserved compute captures value where predictability matters
Inference APIs capture value where utilization and abstraction matter
Growth in one does not cannibalize the other; it often expands the total market.
Clean takeaway
Reserved compute platforms and inference APIs are both attractive, but for opposite reasons: one monetizes predictability with fewer, larger customers; the other monetizes utilization through aggregation across many smaller customers.
Inference Optimization
Utilization vs. Systems-Level Optimization: Why Utilization Dominates Inference Economics
While numerous systems-level optimization companies have developed techniques to enhance performance, only inference APIs—which directly manage GPU resources—possess the capability to optimize utilization.
A common intuition in inference infrastructure is that systems-level optimizations—higher tokens/sec, better kernels, smarter schedulers—are the primary drivers of durable advantage. In practice, for inference APIs, utilization is the first-order determinant of cost, margin, and competitiveness, while systems-level optimizations are second-order and increasingly commoditized.
1) The Two Levers Are Fundamentally Asymmetric
There are two ways to lower effective cost per token:
Increase tokens per second (performance)
Increase utilization (time GPUs are busy)
These levers behave very differently.
Performance improvements reduce cost only if demand exists to consume the additional throughput.
Utilization improvements reduce cost unconditionally, by eliminating idle time.
For most inference workloads—especially user-facing, bursty workloads—idle time dominates waste, not insufficient throughput.
2) Performance Advantages Compress Because Techniques Are Open and Diffuse
(With Representative Vendors)
Across modern inference APIs running similar model classes (e.g., 70B-parameter LLMs on A100/H100-class hardware), real-world tokens/sec variance is relatively narrow and shrinking.
Observed production ranges typically look like:
Lower-throughput, aggregation-optimized APIs:
~120–150 tokens/secHigher-throughput, latency-optimized APIs:
~220–260 tokens/sec
This ~1.3–2.1× spread reflects different optimization priorities rather than fundamentally different technology.
Representative Vendors by Throughput Orientation
(Illustrative, not exhaustive; varies by model, region, and configuration)
Higher Tokens/sec (Latency / Performance Optimized)
These platforms tend to push hardest on kernel-level and model-specific optimizations, often trading off breadth or flexibility.
Fireworks AI
Heavy focus on latency and throughput (tokens/s)
Aggressive batching and kernel tuning
Narrower operational envelope per model
BaseTen (dedicated / reserved setups)
High sustained throughput when utilization is high
Performance stability prioritized over elasticity
Best-case tokens/sec when capacity is fully consumed
Select hyperscaler inference offerings
Deep integration with hardware-specific runtimes
Strong performance under controlled workloads
Lower Tokens/sec (Aggregation / Cost Optimized)
These platforms optimize for heterogeneous demand, model breadth, and utilization, rather than peak throughput.
DeepInfra
Broad model catalog
Conservative batching to support mixed workloads
Optimized for platform-level utilization rather than per-model speed
Together.ai (non-reserved, general API paths)
Trades some peak throughput for flexibility and rapid model availability
Performance varies widely by model and load
General multi-tenant inference APIs
Support many models and traffic shapes concurrently
Throughput traded off in favor of reliability and aggregation
Why These Differences Persist—but Compress
The key observation is not who is faster, but why the gap is bounded:
The fastest vendors rely on:
Flash-Attention variants
TensorRT-LLM
Triton kernels
KV-cache and batching strategies
These techniques are:
Largely open source
Rapidly upstreamed into shared libraries
Adopted across vendors within quarters
As a result:
Performance leaders change frequently
The slowest credible APIs rarely fall more than ~2× behind
The economic impact of performance differences is often dominated by utilization
Key Implication
Being the fastest inference API confers temporary advantage; being the most utilized confers durable advantage.
3) Utilization Variance Is Larger and More Durable
By contrast, utilization variance across inference platforms is both larger and more persistent.
It is common to observe:
~40–55% utilization on lightly aggregated or partially reserved systems
~70–85% utilization on well-designed, multi-tenant inference APIs
This represents a ~1.5–2.0× difference in effective cost, independent of tokens/sec.
Crucially:
Utilization is driven by aggregation, customer mix, traffic heterogeneity, admission control, and product abstraction.
These are business-model and architecture choices, not kernel tweaks.
They do not diffuse via GitHub.
4) Concrete Comparison: Highest vs Lowest Tokens/sec Inference APIs
To make the tradeoff tangible, compare the best-case performance leader with a conservative, aggregation-optimized inference API running the same model class under production conditions.
For a 70B-parameter LLM on A100/H100-class hardware:
Highest-tokens/sec inference API: ~230–260 tokens/sec
Aggressive kernel fusion
Highly tuned attention implementations
Large batch sizes under load
Often prioritizes throughput/latency over flexibility
Lowest-tokens/sec (credible) inference API: ~120–150 tokens/sec
Conservative batching
Broader model catalog
More heterogeneous workloads
Optimized for reliability and aggregation
This is roughly a ~1.7–2.1× gap in raw tokens/sec.
Now layer in utilization:
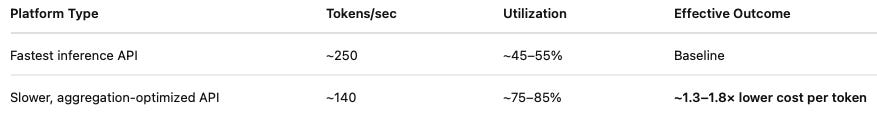
Despite being nearly 2× slower on paper, the aggregation-optimized platform can deliver meaningfully better economics because its GPUs are busy far more of the time.
Two observations follow:
The fastest API is rarely the cheapest in practice. Peak tokens/sec only matters when demand is perfectly aligned and sustained—uncommon outside narrow workloads.
The performance gap is bounded and compressing. Even the slowest serious inference APIs are usually within ~2× of the fastest, while utilization differences regularly exceed that.
In inference APIs, the difference between “best” and “worst” performance is bounded; the difference between “busy” and “idle” infrastructure is decisive.
5) When Systems-Level Optimization Still Matters (Second-Order)
This does not imply systems work is unimportant.
Performance optimizations matter most when:
Utilization is already high and stable
Latency directly impacts revenue
Workloads are homogeneous and predictable
SLAs are strict
In these regimes, performance improvements compound on top of utilization.
However, for most inference APIs, performance is a multiplier on utilization, not a substitute for it.
Clean takeaway
Utilization variance dominates performance variance—and unlike performance optimizations, utilization advantages do not open-source away.
Strategic Synthesis
Utilization determines whether an inference API is competitive at all.
Systems-level optimizations determine how competitive it is once it is.
Because performance techniques are largely open, shared, and fast-diffusing, durable advantage in inference APIs comes from aggregation, abstraction, and control, not raw execution speed.
Utilization Assumptions (for Pricing & Cost Models)
All cost and unit-economics comparisons in this report assume observed production utilization, not theoretical peak throughput. A critical distinction throughout is between customer-level utilization and platform-level utilization—they behave very differently and are often conflated.
Key Definitions
Customer-level utilization: How busy GPUs are for a single customer or single workload.
Platform-level utilization: How busy GPUs are across the entire platform, aggregating many customers and workloads.
Most misunderstandings come from applying customer-level intuition to platform-level economics.
Utilization Tiers Used Throughout
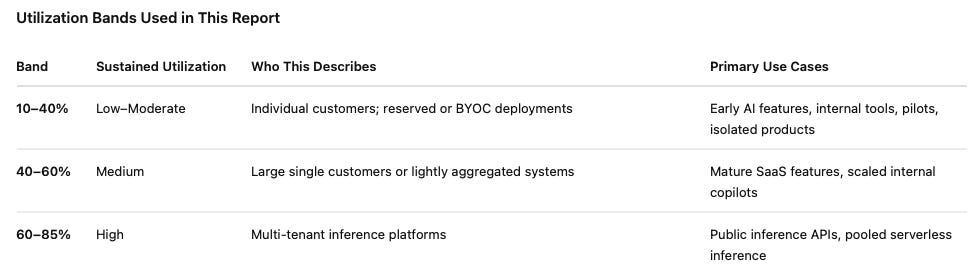
10–40% Utilization: Customer-Level Reality (Small, Isolated, or Reserved)
This band is normal for individual customers, even when systems are well engineered.
Who lives here
Series A–C AI startups
Enterprise internal AI teamsTeams using reserved GPUs or BYOC deployments
Products with one or two core AI features
Why utilization falls in this range
Capacity is provisioned for p95–p99 traffic, not averages
Demand is bursty and diurnal
Multiple models or pipelines fragment GPU memoryLatency SLOs prioritize headroom over cost efficiency
Representative examples
A Series B startup running reserved A100s for a customer-facing copilot
A Fortune 500 company deploying an internal HR or IT chatbot
A SaaS product with one AI feature used heavily during business hours
Key point
Utilization in the 10–40% range reflects traffic isolation and risk tolerance, not poor execution.
This is the dominant reality for most companies below platform scale.
40–60% Utilization: Mature Single-Tenant or Light Aggregation
This band reflects operational maturity without hyperscale aggregation.
Who lives here
Mid-size SaaS companies with steady AI demand
Large enterprises with a single, heavily used internal platform
Vendors offering semi-dedicated capacity to a small number of customers
Why utilization improves
Demand becomes more predictable
Fewer models are active per GPU
Batching and admission control are consistently applied
Representative examples
A public AI SaaS company with steady weekday traffic
A large enterprise analytics copilot used company-wide
Important constraint
This is often the upper bound for single-tenant or lightly multi-tenant systems
Pushing beyond ~60% usually requires:
Aggregating many customers, or
Accepting higher tail latency
60–85% Utilization: Platform-Level Aggregation (Large Platforms)
This band is structurally limited to platforms that aggregate many customers.
Who lives here
Multi-tenant inference APIs
Large inference platforms serving many startups
Hyperscaler-managed inference services
Why utilization is high
Many small, asynchronous demand curves smooth out
Peaks rarely align (statistical multiplexing)
Platforms can batch aggressively and queue intelligently
Startup customers tolerate shared infrastructure and mild latency variance
Representative examples
OpenAI-style public APIs
Large inference platforms serving hundreds or thousands of startups
Critical caveat
Sustained utilization above ~85% sharply increases tail latency and failure risk
Most user-facing platforms deliberately operate below this ceiling
Implications for the Rest of This Report
Startup-heavy platforms can still achieve high utilization
Individual startup customers are low-to-moderate utilization, but aggregating many of them drives platform-level utilization into the 60–85% range.Reserved and BYOC models structurally reduce utilization
Pinning capacity to customers collapses the benefits of aggregation.Utilization differences dominate cost outcomes
A platform running at 70–80% utilization will typically outperform a faster system running at 40–50%, even if tokens/sec is lower.
Utilization is primarily a function of aggregation and abstraction—not company size or engineering quality.
All subsequent cost, performance, and market analysis should be interpreted through this lens.
Why 10–25% Utilization Is Real (and Common)
When people hear “10–25% GPU utilization,” they often imagine mismanagement. In practice, it usually reflects normal product behavior, not incompetence.
1) Early-Stage and Growth-Stage Products
For most inference-backed products before real scale:
Traffic is bursty (peaks during business hours, troughs at night)
Feature usage is uneven (one agent or endpoint dominates)
Capacity is sized for p95 or p99, not average
Result:
Even “healthy” systems sit at 10–30% average utilization.
This mirrors:
Web servers pre-autoscaling
Databases sized for peak QPS
Early SaaS infra economics in general
2) Reserved Capacity Is Sized for Worst Case, Not Average
Any system with:
SLAs
Latency SLOs
Human-facing UX
must provision for spikes, not medians.
Example:
Peak demand: 5× average
You size for peak
Average utilization → ~20%
This is by design, not error.
3) Multi-Model and Multi-Tenant Fragmentation
Utilization collapses when:
Multiple models are deployed in parallel
Each has independent traffic patterns
GPU memory constraints prevent consolidation
Even if total demand is high:
Individual GPUs may be underutilized
Fragmentation blocks efficient packing
This is especially common in:
Enterprise copilots
R&D-heavy teams
Products experimenting with multiple models
4) Why Serverless APIs See 60–85% While Customers See 10–25%
This is the key contrast.
Single customer / reserved setup
Demand curve = narrow
Variance = high
Utilization = low
Aggregated serverless platform
Demand curves from thousands of customers overlap
Variance smooths out
Utilization rises to 60–85%
This is not magic — it’s statistical multiplexing.
Is 10–25% the Floor or the Average?
Important nuance:
10–25% is common for:
Early-stage products
Reserved GPUs
Internal tools
40–60% is achievable for:
Mature SaaS with predictable usage
Well-tuned admission control
70–85% is rare outside:
Large serverless platforms
Highly constrained, always-on workloads
Sustained >85% utilization is dangerous unless you’re:
Willing to drop requests
Willing to increase latency
Quantitative Reality Check
Consider a product with:
8 hours/day of peak usage
16 hours/day of low usage
2× peak-to-average ratio
Even with good smoothing:
That’s a well-run system.
Now add:
Model experimentation
Geographic skew
Release cycles
You’re back in the 20–30% range quickly.
Why This Matters Strategically
This is why:
Reserved GPU inference looks cheap on paper and expensive in reality
Performance optimizations often disappoint economically in isolation
API-based inference dominates long-term share
It also explains why:
Systems that maximize utilization outperform those that maximize peak throughput
Control planes beat raw execution engines
Inference APIs vs. Customer Utilization: Why Startup-Heavy Platforms Can Run High Utilization
A common misunderstanding in inference economics is the assumption that serving mostly startups implies low utilization. This confusion comes from conflating customer-level utilization with platform-level utilization—two very different things.
Customer-Level vs Platform-Level Utilization
At the customer level (typical startup behavior):
Utilization is often low (10–30%)
Traffic is bursty and uneven
Workloads are small and episodic
Capacity is sized for peaks, not averages
This is true for most startups, and it is entirely rational.
At the platform level (inference APIs):
Hundreds or thousands of independent demand curves are aggregated
Peak usage times rarely align
Idle capacity smooths out statistically
This is classic statistical multiplexing.
A platform serving many low-utilization customers can itself operate at 60–85% utilization.
This is not unique to inference. It is exactly how infrastructure platforms like:
AWS EC2
Datadog
Stripe
Twilio
achieved strong unit economics early—despite serving predominantly small customers.
Why Startup Customers Often Improve Platform Utilization
Counterintuitively, startup-heavy customer bases are often better for utilization than a few large customers.
1) Asynchronous, Heterogeneous Workloads
Startups tend to:
Operate across time zones
Have different peak hours
Use different models, endpoints, and request shapes
This creates natural demand smoothing.
Contrast this with:
One large enterprise customer
One internal copilot
One dominant model
Those scenarios concentrate demand and make it harder to keep GPUs busy.
2) Fewer Hard SLAs
Startup customers are typically more tolerant of:
Mild latency variance
Queueing under load
Shared infrastructure
That tolerance allows inference APIs to:
Batch more aggressively
Apply stricter admission control
Run GPUs closer to saturation
By contrast, enterprise customers often impose:
Dedicated capacity requirements
Strict tail-latency guarantees
Isolation constraints
All of which structurally reduce utilization.
3) Minimal Demand for Reservation or Isolation
Most startups:
Do not request dedicated GPUs
Do not require VPC isolation
Default to fully serverless APIs
This allows inference platforms to:
Pool capacity globally
Move workloads dynamically
Optimize scheduling and batching across customers
That flexibility is the core utilization advantage of inference APIs.
When Utilization Drops for Inference Platforms
There are two scenarios where even inference APIs experience utilization pressure.
1) Growth in Reserved or Dedicated Capacity
If a platform:
Pins GPUs to specific customers
Sells large amounts of reserved capacity
Guarantees isolation or fixed latency
Then utilization begins to resemble:
40–60% in well-sized cases
20–40% when demand variance is high
This is why reserved inference tends to be expansion revenue, not the economic core.
2) Heavy Skew to a Single Model or Workload
Utilization also drops when:
A single model dominates demand
Requests cluster in time
Latency SLOs are strict
In these cases:
Capacity must be overprovisioned
Scheduling flexibility decreases
However, these are also situations where:
Pricing power increases, or
Routing and scheduling logic becomes strategically valuable
Where Inference APIs (i.e. DeepInfra, Fireworks, Together) Sit (Illustrative, Not Unique)
For a modern inference API with:
A serverless model
A startup-heavy customer base
A broad catalog of models
It is reasonable to expect:
Platform-level utilization: ~60–80%
Customer-level utilization: often 10–25%
Effective economics: closer to hyperscale APIs than reserved-GPU platforms
In other words:
Startup customers are low-utilization individually.
Inference APIs that aggregate them do not have to be.
This dynamic is inherent to the API model itself, not specific to any single provider.
Why This Matters Strategically
This distinction explains several broader conclusions in the report:
What segments of the market API-based inference versus reserved capacity captures long-term
Why utilization variance dominates performance and tokens/sec variance
Why inference APIs are structurally different from reserved-GPU platforms
It also clarifies why inference APIs optimized for aggregation and cost discipline are not simply “worse versions” of platforms optimized for model novelty or research adjacency. They are solving different problems and, critically, exhibit different utilization dynamics.
Clear and practical analysis, highlighting that in inference economics, maximizing utilization often outweighs raw performance as the key driver of durable advantage
This really clicked for me, especially the customer-level vs platform-level utilization distinction.
What I appreciated is how clearly this explains why low utilization on reserved or hourly compute is often a rational outcome, not a failure. If you are a customer sizing for p95–p99 traffic, dealing with roadmap uncertainty, and running human-facing workloads, 10–40% utilization is kind of the default state.
It also mirrors how mature hyperscalers evolved. Reserved instances looked great on paper, but over time commitments became a way for providers to drive predictability, utilization, and revenue visibility. The efficiency gains were real, but the variance risk largely moved onto customers.
Your point that “reserved inference tends to be expansion revenue, not the economic core” stood out. It feels like reserved inference is less about where platforms want to be at the core, and more about where providers naturally push as usage stabilizes and financing efficiency starts to matter.
If that’s right, we probably replay a familiar pattern: commitments increase to improve provider economics, while customers still struggle with forecasting and workload variability.
Which makes the utilization and aggregation lens you lay out even more important as inference moves from experimentation to real scale, especially as demand smoothing and risk shifting start to matter as much as runtime efficiency.
Really strong piece - this should be required reading for anyone thinking seriously about inference economics.