


A gigawatt of AI compute costs about $37.6 billion. I know because I estimated one, layer by layer, from the interconnection queue to the last strand of fibre. This is what the money buys.
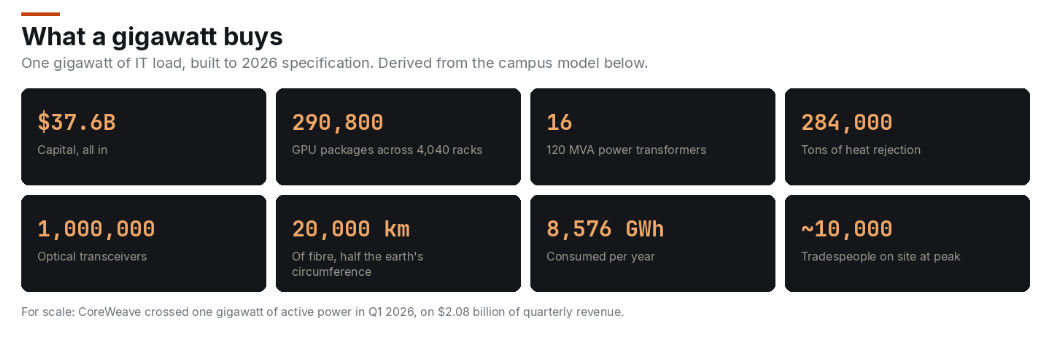
Six and a half years from filing to first token, and 57 cents of every dollar never reaches a semiconductor company. CoreWeave passed one gigawatt of active power this spring and runs it at $8.31 billion of annualised revenue, so the scale is real and it is operating today.
The cost is the easy half. The harder question is what happens to it afterwards, and that is where this got interesting.
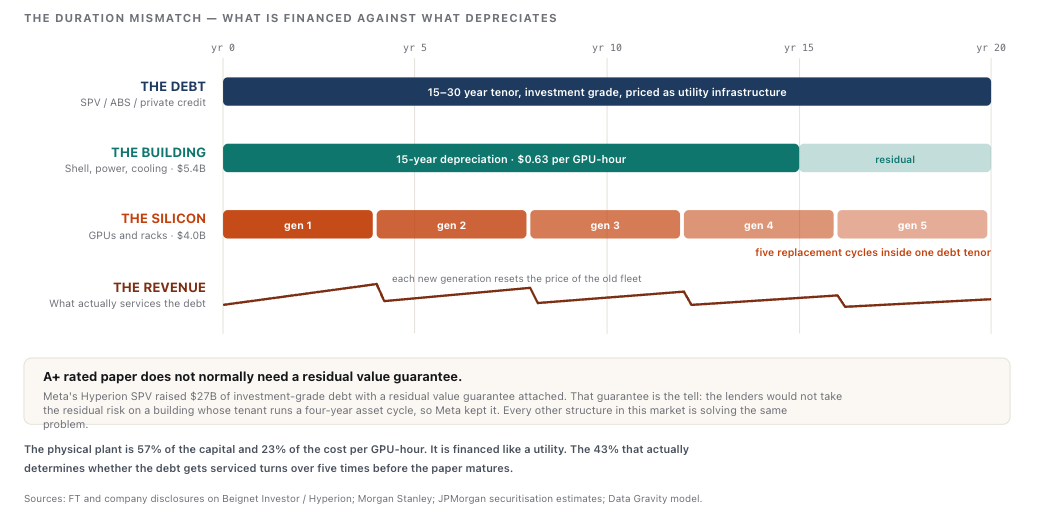
The physical plant lasts fifteen years and is financed on paper of about that tenor. The silicon that generates the revenue to service that paper has an economic life of three to four years, and loses most of its pricing power inside each turn. Nearly every unusual structure in this market exists to manage that gap.
Pricing the output turned out to matter more than pricing the input. At the wholesale rate CoreWeave’s own disclosures imply, the campus returns 13.4% over fifteen years. Drop fleet utilisation from 90% to 70% and that becomes 1%. Not a crash, not a demand shock. An ordinary year with some idle capacity, against a silicon bill that arrives every four years regardless.
What follows is the whole stack, because the arithmetic is the argument. The worked example below is a quarter of a gigawatt, which is the size real projects actually get built at. Multiply by four wherever you like.
Three clocks
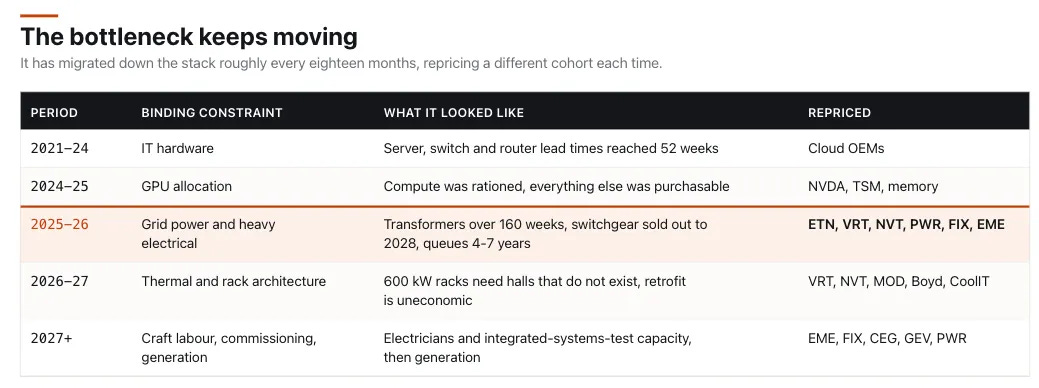
Start with why the physical layer takes so long. NVIDIA ships a new rack platform every twelve months. A building takes 24 to 36 months. Getting power takes four to seven years.
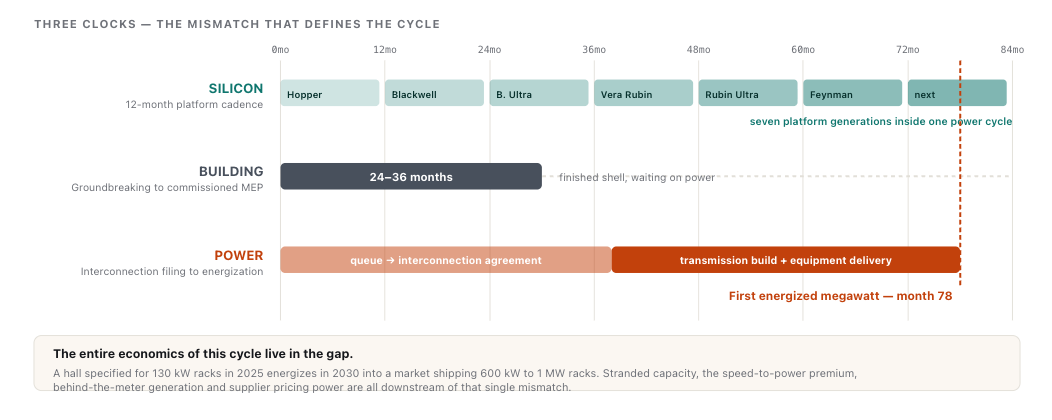
A hall specified for 130 kW racks in 2025 energizes in 2030, into a market shipping 600 kW racks. Most of what looks odd about this sector follows from that: operators overbuilding electrical headroom they cannot populate for years, the premium on already-energized industrial sites, the sudden interest in behind-the-meter gas, and the pricing power sitting with anyone who can shave a year off a schedule.
Hyperscaler capex will land between $600 and $725 billion this year. Dell’Oro has global data center capex crossing a trillion. Nobody thinks money is the constraint. Transformer lead times are past 160 weeks. Switchgear is booked through 2028. Of the 12 GW of U.S. capacity supposedly arriving in 2026, about a third is under construction. The rest is financed, permitted, and stuck.
Which is the useful way in. If capital is not the constraint, then the only way to understand this buildout is to price the things that are.
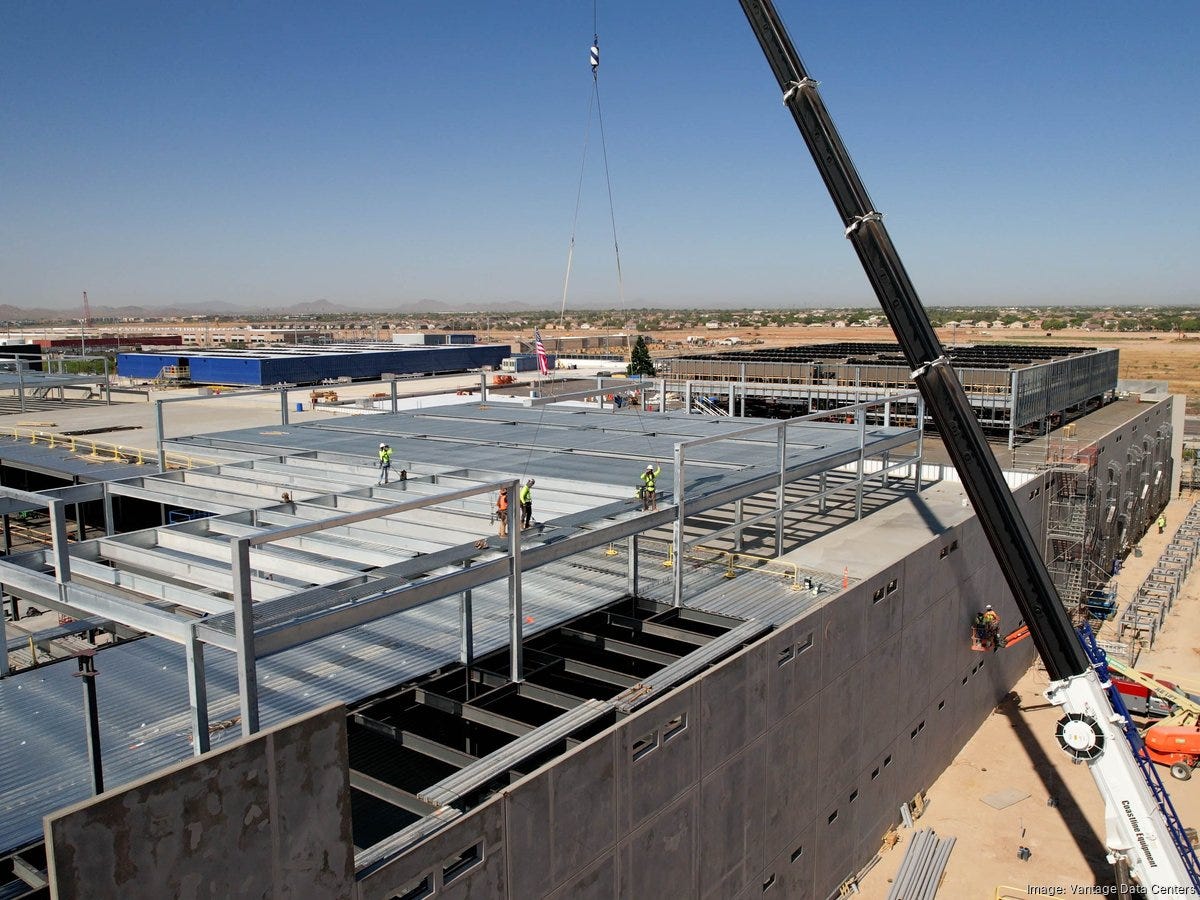
Aerial or elevated view: steel frame, substation pad, laydown yard in one frame. The laydown yard is the detail worth seeing. It stays for years.
What the $37.6 billion buys
Everything below refers to the same project. I derived the equipment counts rather than asserting them, so you can change an input and rerun it.
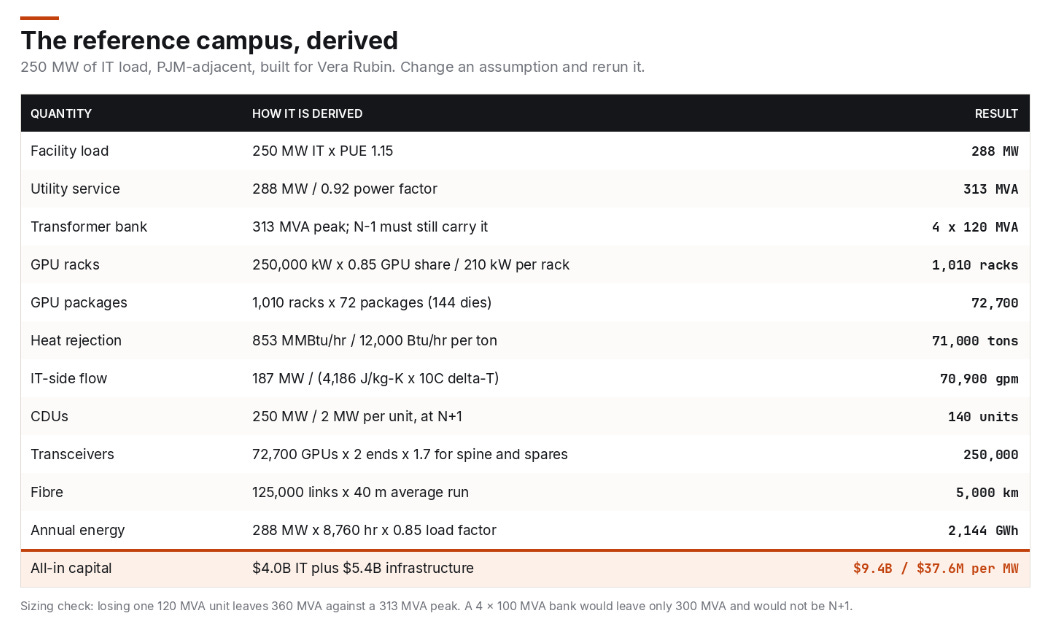
Two need a flag. The transformer bank has to be sized on the N-1 case, not the peak. At 313 MVA, losing one unit of a four-by-100 MVA bank leaves 300 MVA and the campus sheds load, so the units go to 120 MVA and N-1 carries 360. And the flow rate assumes 75% of heat leaves through liquid. The other 25% still needs air handling, so liquid-cooled halls still have CRAH units, and retrofit budgets that skip this come in low.
Schedule: 78 months from interconnection filing to first token. The four longest items on the critical path are all electrical. Note the sequencing that forces. The transformer order goes in around month 12, two years before the building it serves is designed in detail, often before a tenant signs. Speculative transformer orders are now normal, and there is a working secondary market in reserved factory slots.
Power
Eight voltage conversions sit between the transmission line and a GPU. Each is a separate industrial supply chain with its own oligopoly and its own way of failing.
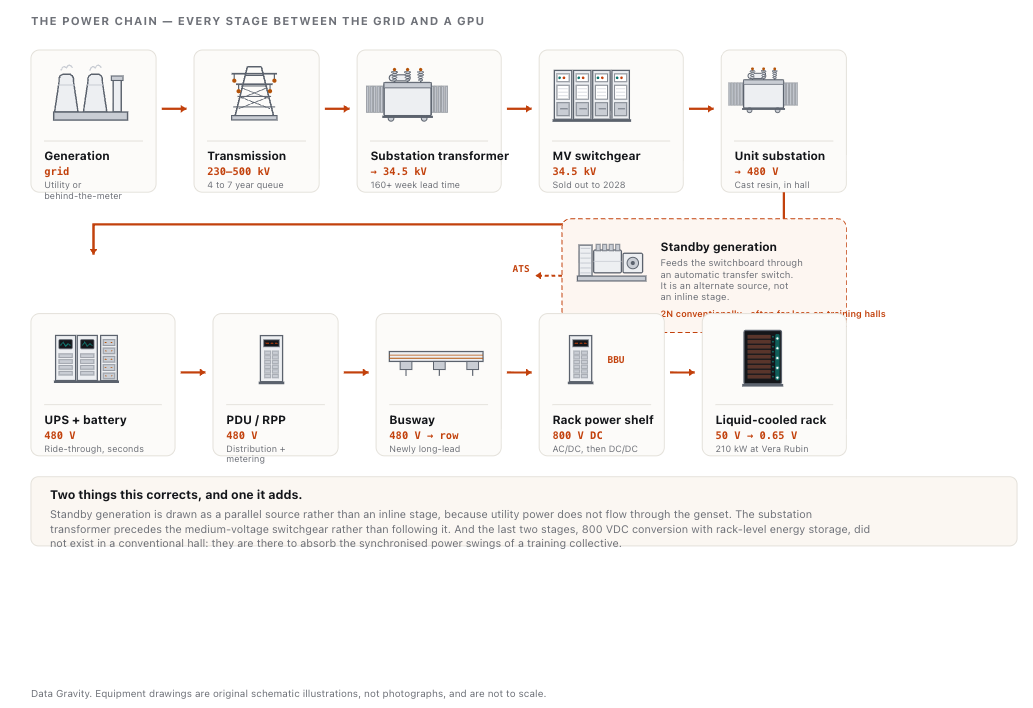
The stage that surprises people is the last one. Everything to the left of the rack existed in some form in a 2015 data center. The 800 VDC shelf and the rack-level battery do not have an analogue, and they are there for a specific reason: a training collective makes tens of megawatts appear and disappear in milliseconds, and the distribution system has to absorb that without passing it upstream to the utility.
Land and the queue
Site selection used to weigh latency, tax abatement and fiber. Now it weighs one thing: how fast can this site get power. In practice developers screen first for an existing queue position, or an energized substation with a spare bay. Then transmission within a few miles, on two independent corridors. Then room for gas or batteries as a bridge. Then water rights. Then whether the local union hall can field a thousand electricians for two years.
PJM projects entering service in 2025 averaged over seven years: three-plus to get an interconnection agreement, then about four more waiting to energize. The bottleneck moved downstream. It is no longer the study, it is physical delivery of transmission and equipment.
The base rate is worse than people assume. Of all capacity that entered queues between 2000 and 2019, 13% had reached commercial operation by the end of 2024. Entering a queue is easy. Clearing one is not.
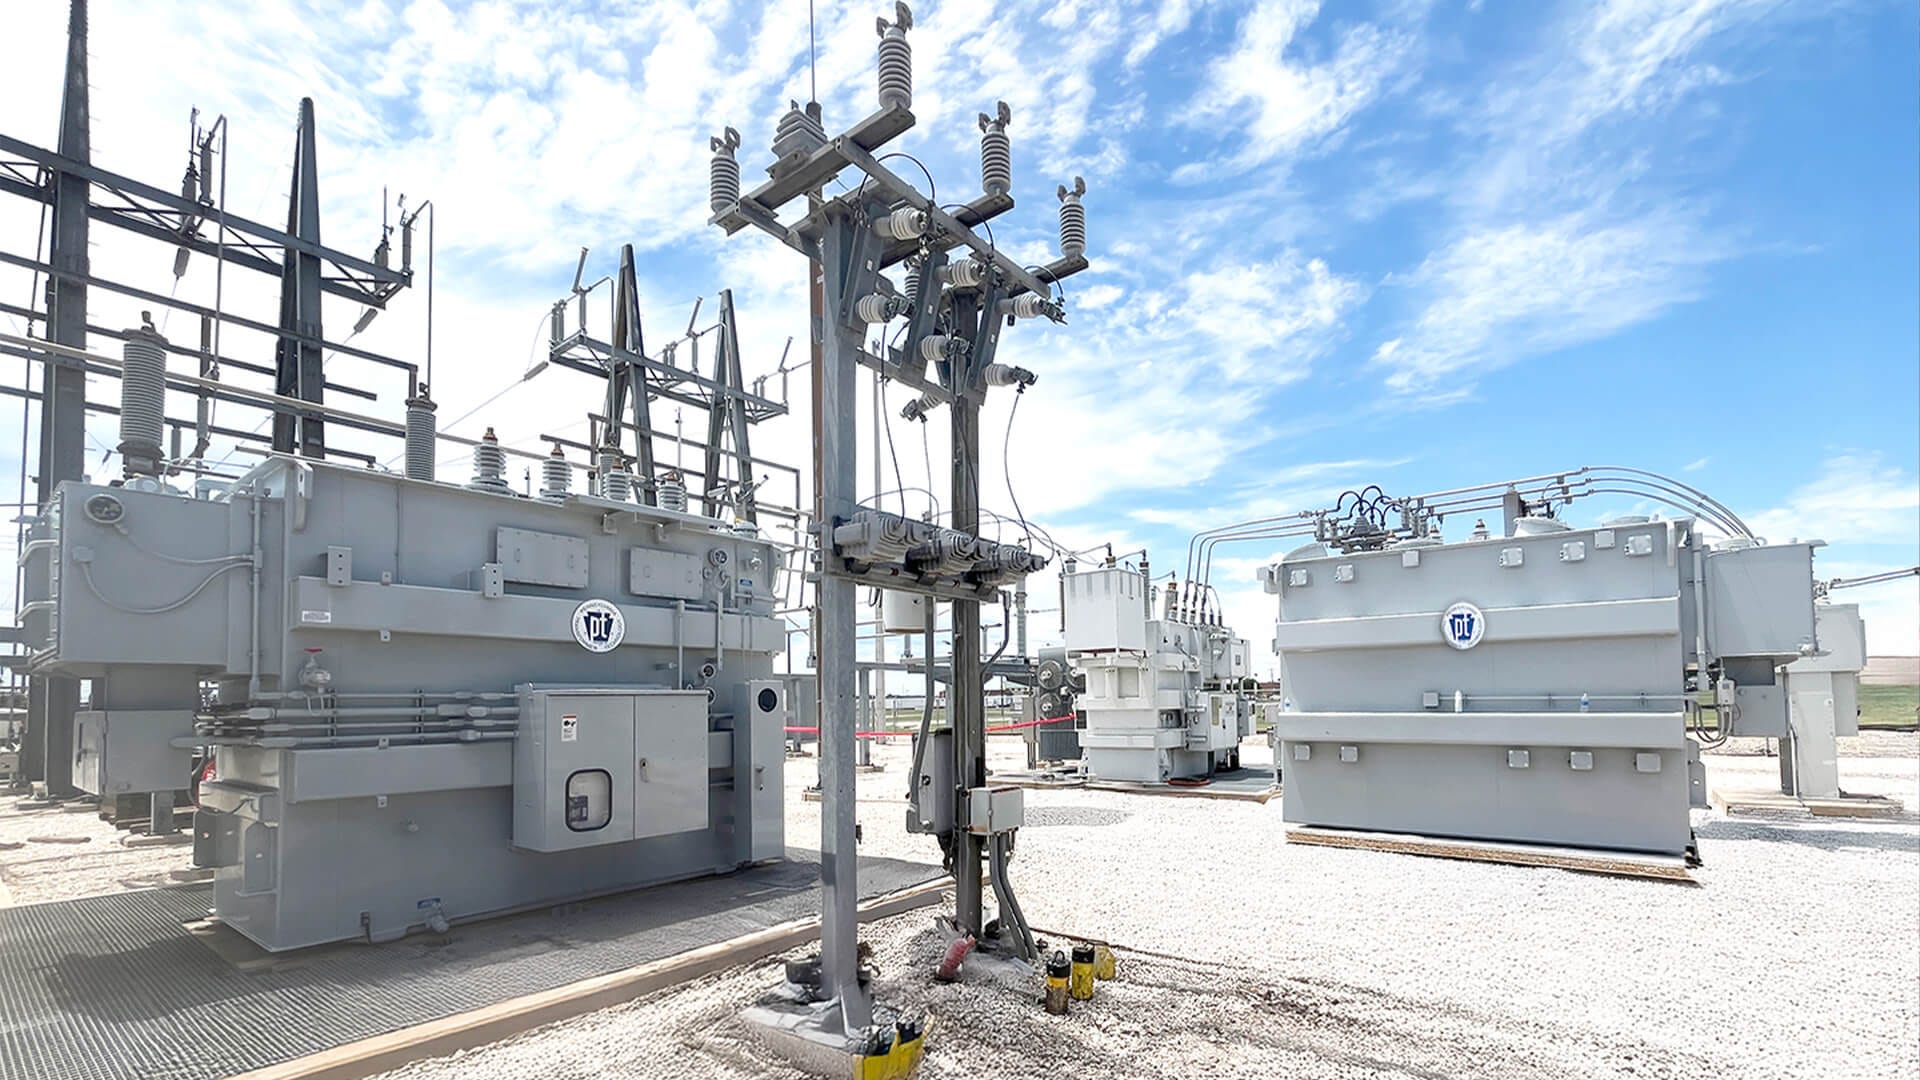
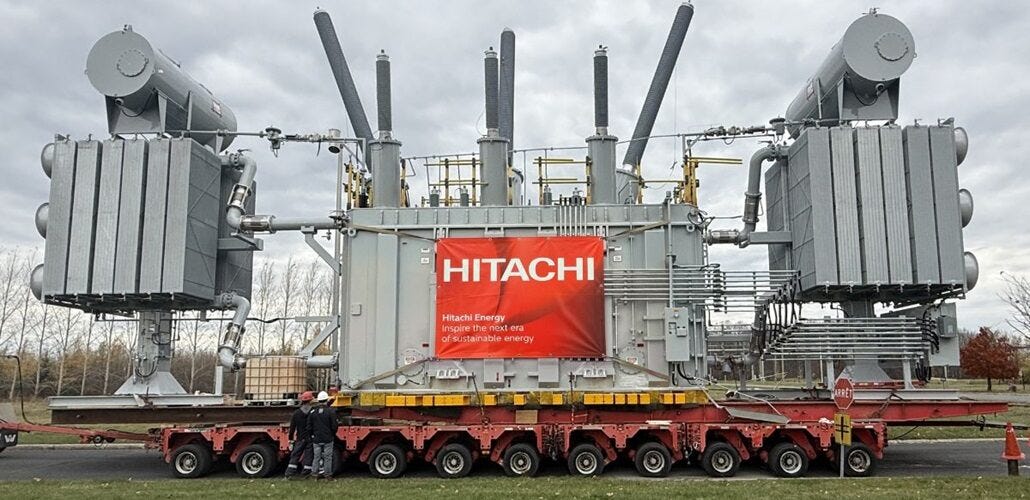
230 kV customer substation serving a data center, Quanta Services
Transformers and switchgear
A large power transformer is bespoke: grain-oriented electrical steel, copper windings, custom bushings, a test bay, and a heavy-haul route to site. You cannot flex that capacity on any useful timescale.

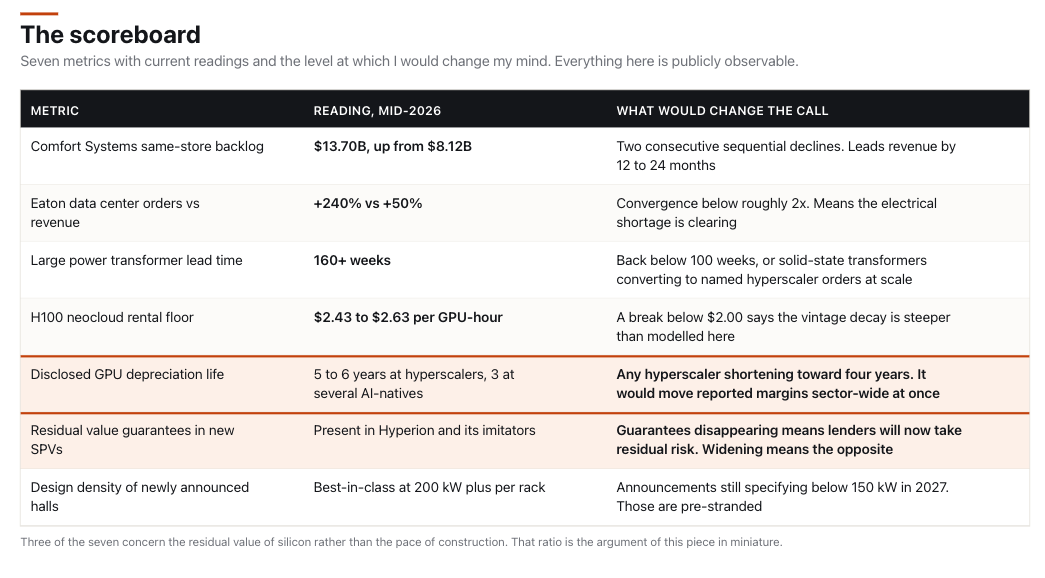
Eaton has guided to solid-state transformer orders in the second half of 2026, shipping late 2027. First real technology relief valve, and it arrives after this capex wave. Watch whether those orders show up as commercial-scale commitments from named hyperscalers or as pilots. The difference tells you whether it is real.
Switchgear is effectively sold out through 2028, with high-voltage breakers at 18 to 24 months. Eaton’s numbers show what that does to a P&L. Q1 2026 revenue was $7.45 billion, up 17%, on a $22.8 billion backlog. But data center orders were up 240% and data center revenue up 50%. When orders grow fourteen times faster than the corporate top line, mix is the whole story. Forgent Power Solutions has a nearly $2 billion revenue backlog, primarily across switchgear and other power infrastructure products, up 157% year over year.
Which raises a question the sector rarely answers directly: why do these lead times turn into margin rather than share loss? Because the layers are concentrated enough that nobody has to compete on price.
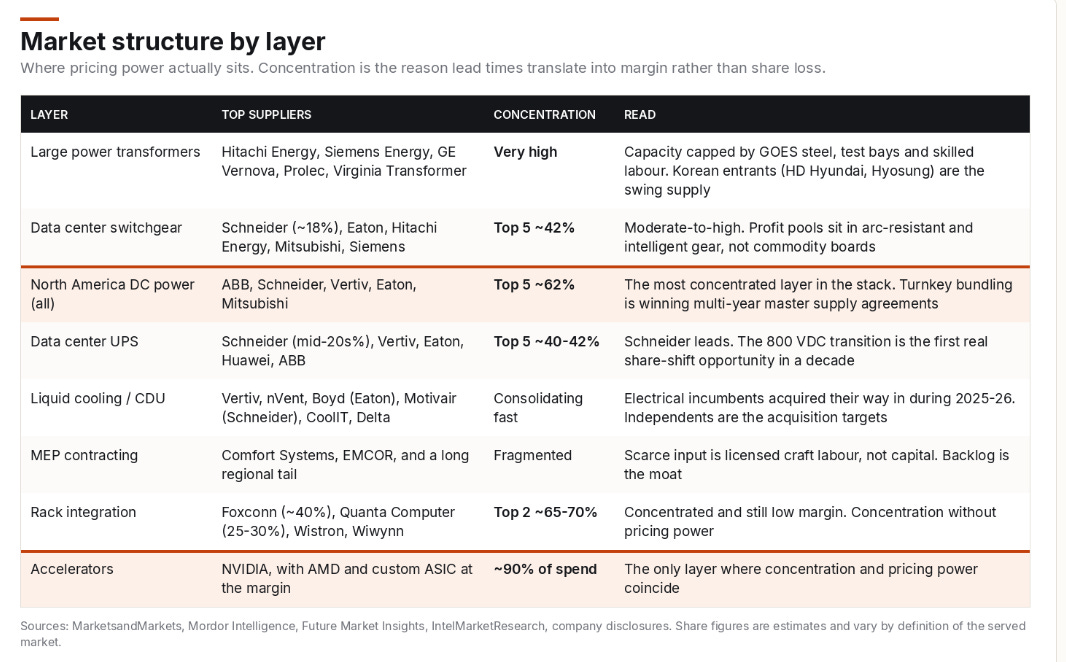
The top five suppliers control 62% of North American data center power. In transformers the concentration is higher still, capped by grain-oriented steel and test-bay capacity rather than by capital. Rack integration is the instructive counter-example: Foxconn and Quanta hold 65 to 70% between them and still run single-digit to low-teens gross margins. Concentration without pricing power is just concentration.
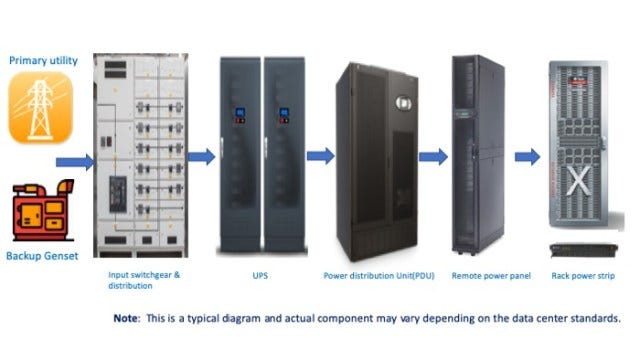
UPS, generators, busway
AI training does not draw power smoothly. It draws a synchronised square wave, tens of megawatts stepping on and off in milliseconds as an all-reduce completes across the cluster. That is a power-quality problem, not a capacity problem. Vera Rubin includes 20 times more on-rack energy storage than Blackwell purely to smooth it.
The bigger consequence gets missed. A training cluster restarts from checkpoint, so losing power costs you minutes, not data. Several AI-native operators have concluded that full 2N generator backup on training halls protects against a failure the workload already tolerates, and are building to lower tiers. On this campus that is the difference between about ninety 3.25 MW gensets and almost none. Call it $250 to $350 million and a year of procurement.
Busway is the one nobody was watching. Sightline Climate added it to the long-lead list for the first time in May 2026, which tells you the constraint now covers the entire path from substation to server rather than one point on it. Moving to 800 VDC pushes 150% more power through the same copper and removes some 200 kg of busbar per rack, about 200 tonnes across this campus.
Heat
Every watt into a GPU comes back out as heat. This campus is a 250 MW heater. Water carries about 3,500 times more heat per unit volume than air, so past 50 or 60 kW per rack, air stops being an option.
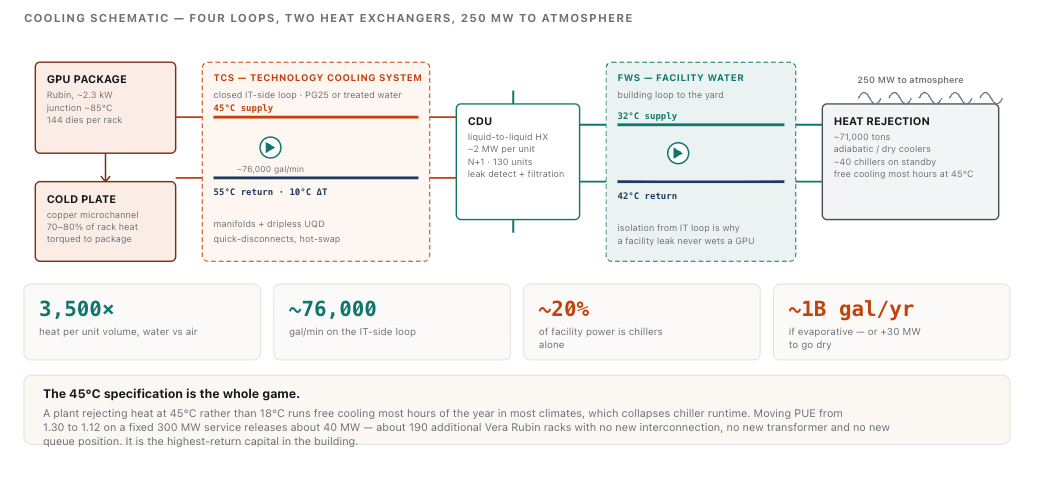
The water-versus-power trade decides more than it looks like it should. Evaporative cooling on this campus runs on the order of a billion gallons a year. Going fully dry eliminates that and costs about 30 MW of extra electrical load. At a fixed 300 MW service, 30 MW is about 140 Vera Rubin racks you no longer get to install. Water and compute are directly interchangeable, and in most 2026 markets water is the cheaper of the two.
The 45°C specification follows from the same logic. Chillers eat a fifth of facility power. A plant rejecting heat at 45°C instead of 18°C runs free cooling most of the year in most climates. Moving PUE from 1.30 to 1.12 on a 300 MW service frees about 40 MW, or 190 more racks, with no new interconnection and no new transformer. Best return on capital in the building.
Note who has been buying: Eaton acquired Boyd Thermal in March 2026, Schneider owns Motivair. The electrical incumbents bought into thermal because customers want power and cooling as one reference architecture. Vertiv already had that, which is much of why it holds the position it does.
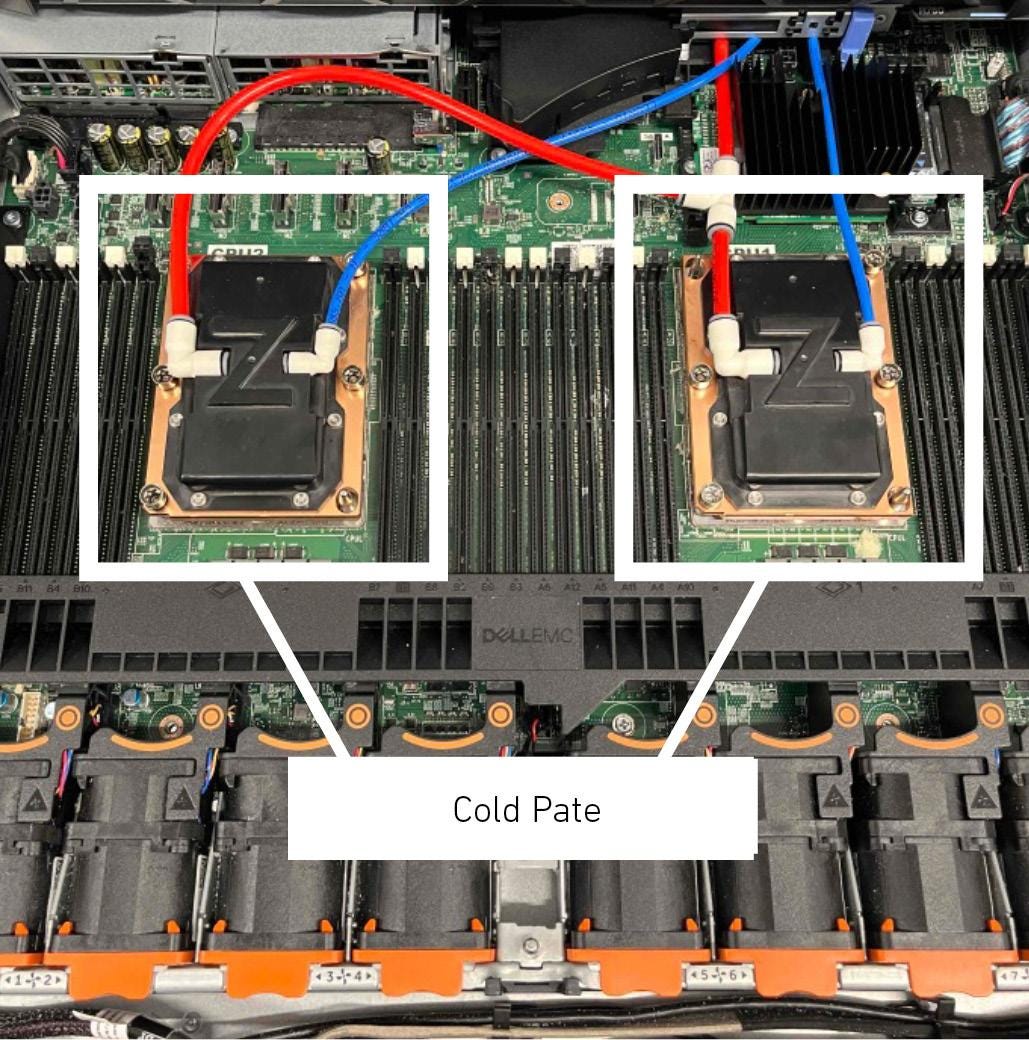
Source: Mitsubishi Electric
Compute
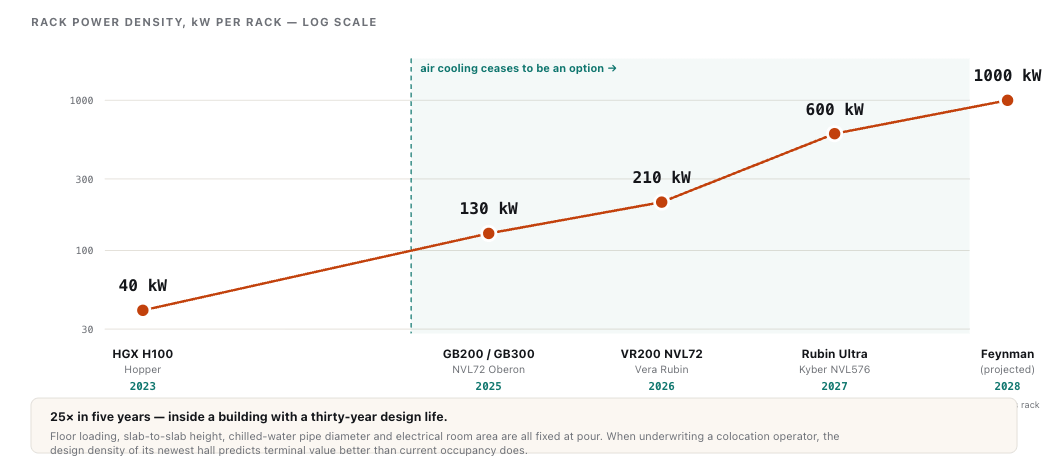
Vera Rubin replaces the cable backplane with a PCB midplane, runs a liquid-cooled busbar at 50 V into the compute trays with DC-DC shelves stepping down from 800 V, and carries 20 times the on-rack energy storage. Kyber in 2027 turns eighteen blades vertical to fit 576 GPUs into one scale-up domain.
Slab-to-slab height, floor loading, pipe diameter and electrical room area are fixed when you pour. When you underwrite a colo operator in 2026, the design density of the newest hall tells you more about terminal value than current occupancy does.
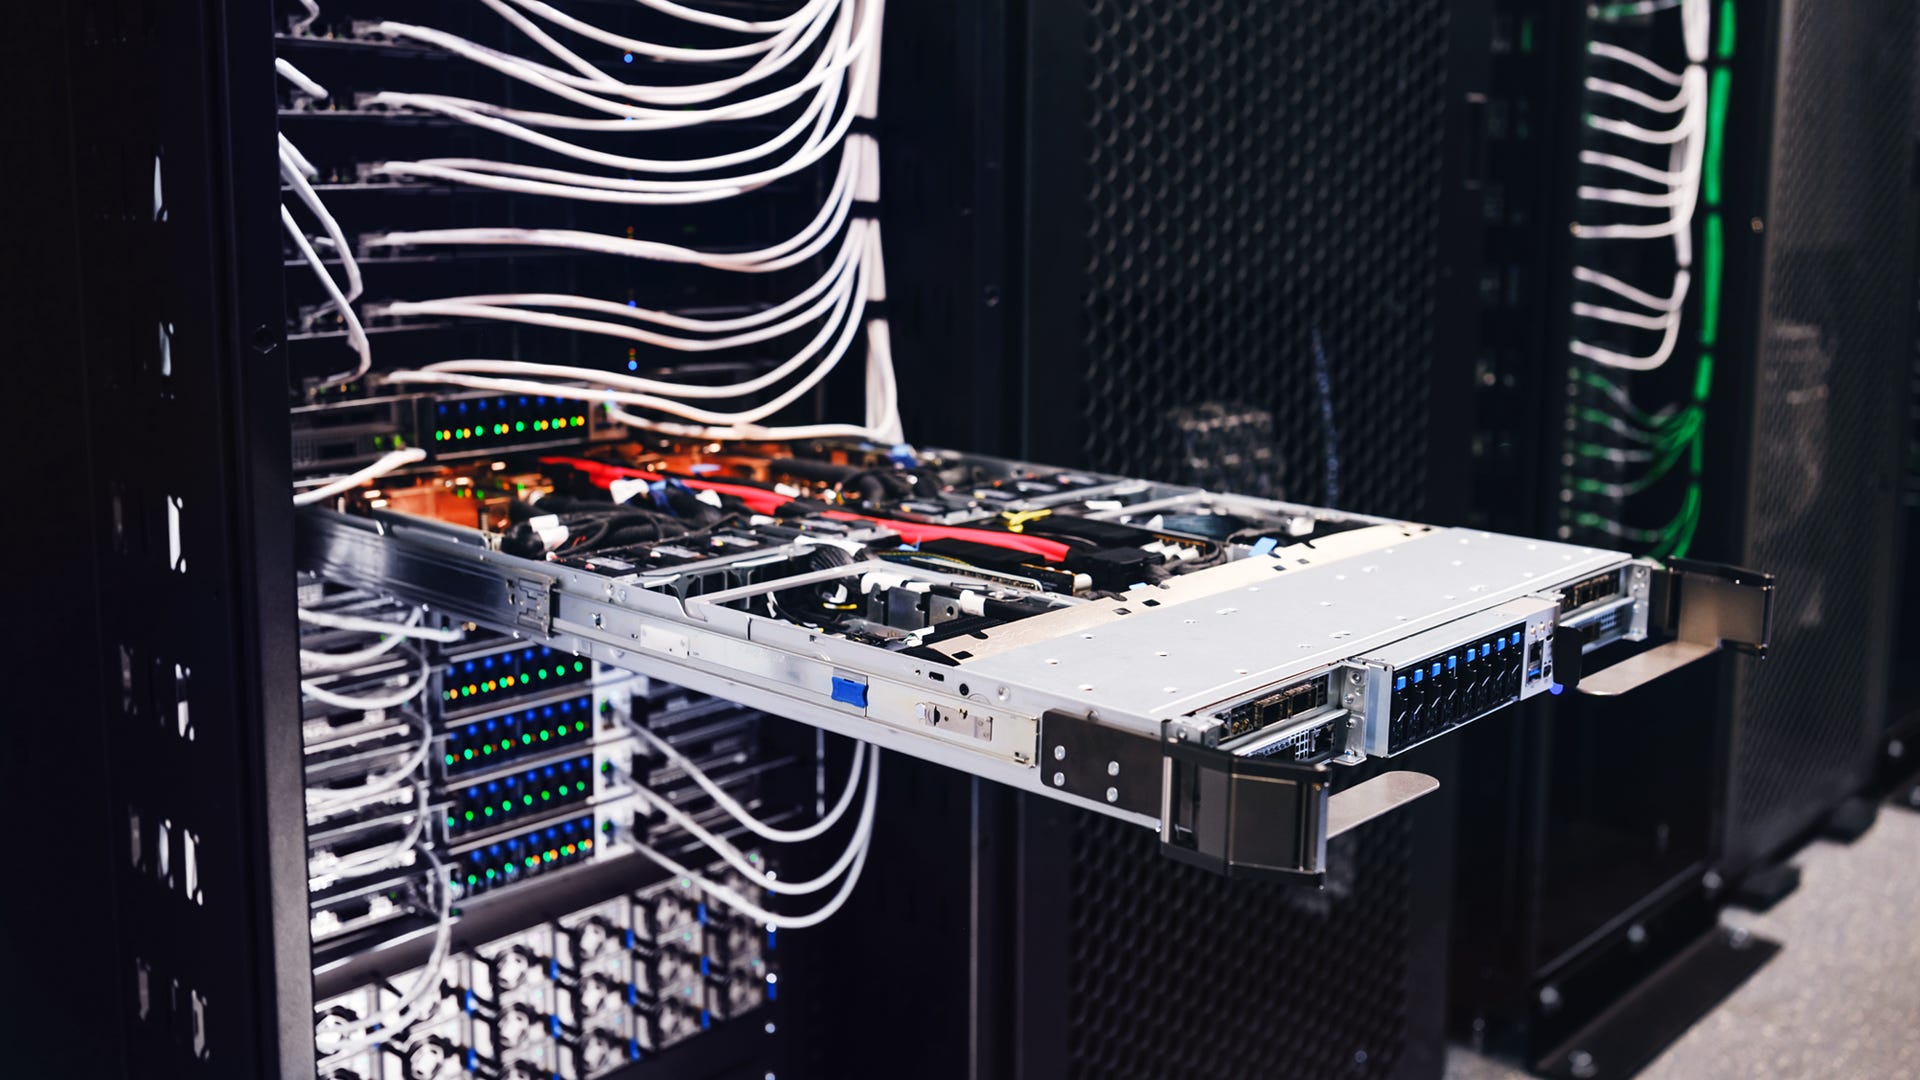
Source: Nvidia
Networking, optics, storage
Three separate networks, and conflating them is the most common analytical error here. Scale-up is NVLink over copper inside the rack, 72 packages at 3.6 TB/s per GPU, under two metres. Scale-out is Ethernet or InfiniBand across the hall at 800G moving to 1.6T, almost entirely optical. Scale-across is coherent DCI between buildings, which exists because single-site power has capped out and a frontier run now has to span campuses.
The constraint underneath all three: an idle GPU is the most expensive object in the building. A $4 million rack stalling on a gradient all-reduce burns capital faster than any network saving recovers, so AI fabrics run near 1:1 subscription and eat far more optics per unit of compute than cloud ever did. This campus takes about 250,000 transceivers and 5,000 km of fibre. Call it $200 million of optics.


One structural oddity. In every previous optical cycle a speed generation ramped, plateaued and got replaced. This time 800G, 1.6T and 3.2T are ramping simultaneously. That holds demand across more of the supply chain and delays the inventory digestion that ended every prior cycle. Whether it survives 2027 and 2028 is the open question for the sector, and I have not seen a convincing answer either way.
Storage gets ignored and causes disproportionate pain, and the driver is checkpointing rather than capacity. A two-trillion-parameter model in bf16 carries about 4 TB of weights, 8 TB of fp32 master weights and 16 TB of Adam optimiser moments. Roughly 28 TB per checkpoint, and the cluster sits idle while it writes. Keeping that stall under ten seconds needs 2.8 TB/s of write bandwidth. That number sets the architecture. It also explains why parallel filesystem vendors keep showing up as gating suppliers on cluster bring-up.
Commissioning
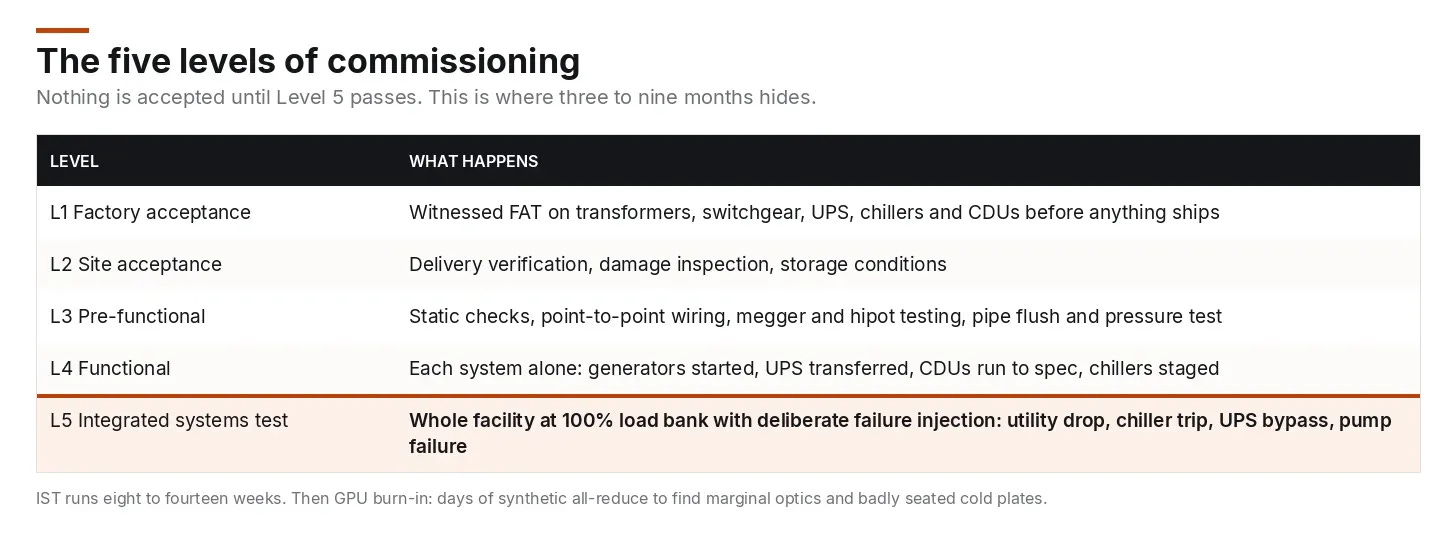
Integrated systems testing runs eight to fourteen weeks and reliably finds control-sequence failures that no individual system test catches. A chiller that fails to restage after a generator transfer. A CDU that alarms during a voltage sag. A building management system fighting the electrical monitoring system. Then GPU burn-in, days of synthetic all-reduce hunting for marginal transceivers and badly seated cold plates.Assume three to nine months between mechanically complete and revenue generating, and discount capacity announcements accordingly. A delayed 60 MW facility costs about $14 million a month in foregone revenue. Operators will pay almost anything to compress that window, and commissioning agents have quietly become a constrained resource of their own.
What the output costs
$9.4 billion and six and a half years spent. An hour of GPU time costs this much to produce.
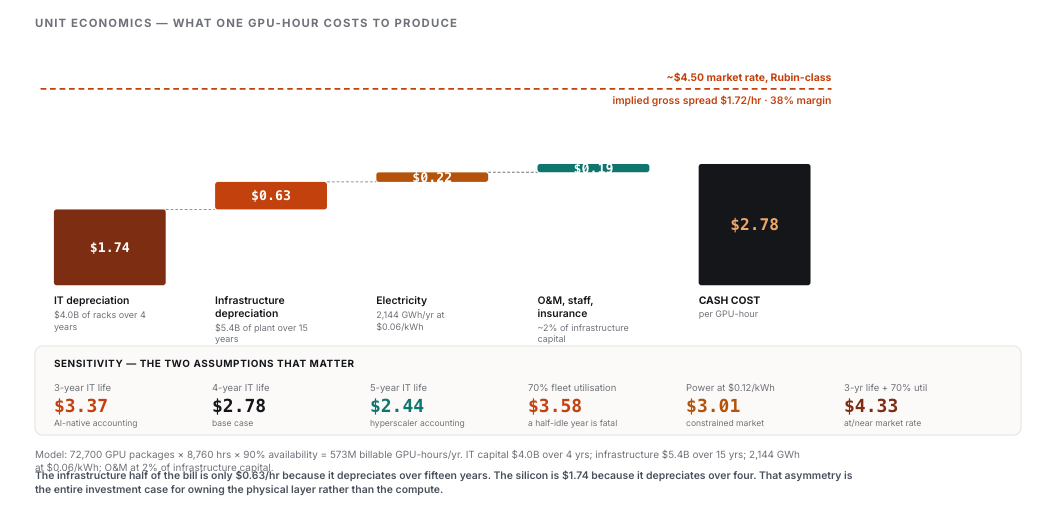
72,700 packages times 8,760 hours at 90% availability gives 573 million billable GPU-hours a year. Against that: $4.0 billion of IT on a four-year life, $5.4 billion of infrastructure on fifteen, 2,144 GWh at six cents, and O&M at 2% of infrastructure capital. Cash cost is $2.78 per GPU-hour.
Note the split, because it is the argument. Fifty-seven percent of the capital contributes 63 cents an hour. Forty-three percent contributes $1.74. The infrastructure is cheap per unit of output precisely because it lasts, and the silicon is expensive precisely because it does not.
What the output sells for
This is where most models of this business go wrong, including my first pass at it. There is no single price per GPU-hour. There is a decay curve, and it is steep.
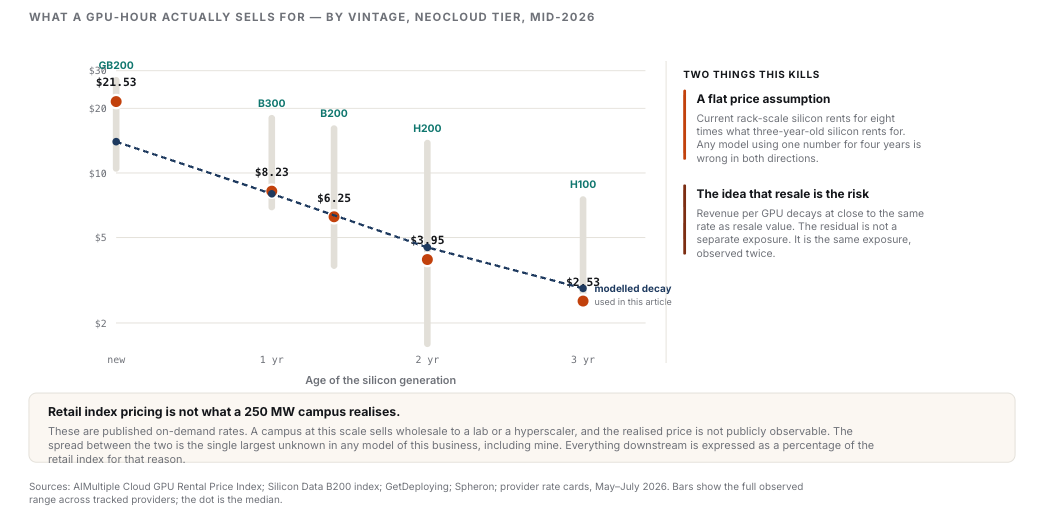
GB200 rack-scale capacity currently rents between $10.50 and $27.04 per GPU-hour across tracked providers. H100, two and a half years old, sits at $2.43 to $2.63 on the neocloud tier. B200 and H200 fall in between, in vintage order. That is not noise around a mean. It is a curve.
The implication matters more than the numbers. Revenue per GPU decays at close to the same rate as resale value. The residual on the silicon is not a separate exposure that shows up when you sell the fleet. It is the same exposure, observed twice, and it starts eroding cash flow in year two.
One caveat before the returns math, because everything downstream depends on it. Those are published on-demand rates. A 250 MW campus does not sell on-demand at retail. It leases wholesale to a lab or a hyperscaler, and that realised price is not published. Rather than pick a number and pretend, I have expressed everything below as a percentage of the retail index, and then checked the answer against a company that discloses enough to derive it.
Does it earn the capital back?
Cash cost is not where anyone should stop. The question is whether the campus returns its capital across a full infrastructure life, with silicon replaced every four years and each new generation entering at the top of the decay curve.
At a 55% wholesale realisation, which implies a lifetime average around $4.04 per GPU-hour, the campus returns 13.4%. Breakeven against an 8% unlevered hurdle is 49% of the retail index, or about $3.62 average. Above that it works. Below it, it does not, and at 35% the project destroys capital outright.
But price is not the variable that decides this. Utilisation is. Moving from 90% to 70% fleet utilisation takes the IRR from 13.4% to 1.0%. Price would have to fall by a fifth to do equivalent damage. The reason is the treadmill: $4 billion of silicon has to be bought every four years whether the fleet is busy or not, and a half-idle fleet still pays for it in full.
Almost nobody discloses utilisation. If you take one operational metric away from this piece, make it that one.
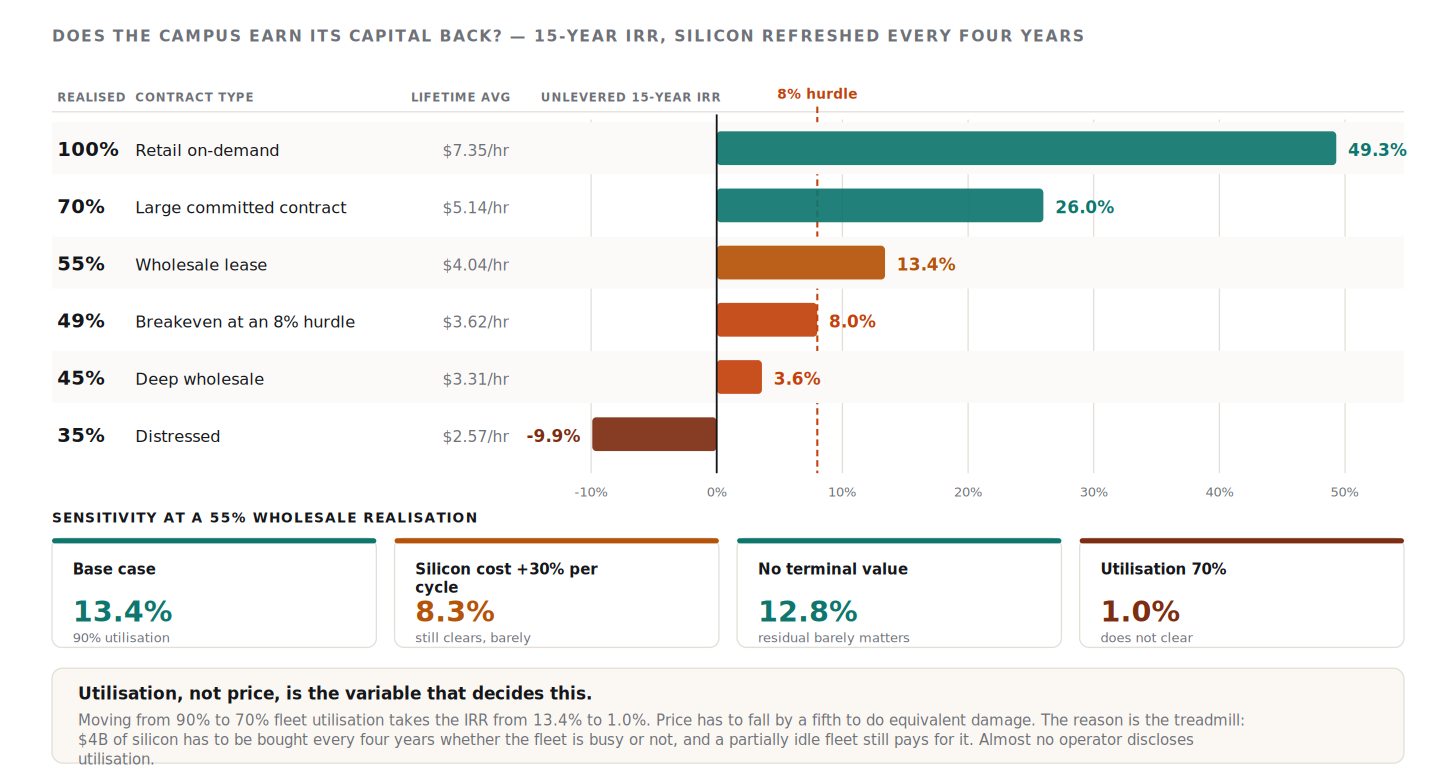
At a 55% wholesale realisation, which implies a lifetime average around $4.04 per GPU-hour, the campus returns 13.4%. Breakeven against an 8% unlevered hurdle is 49% of the retail index, or about $3.62 average. Above that it works. Below it, it does not, and at 35% the project destroys capital outright.
But price is not the variable that decides this. Utilisation is. Moving from 90% to 70% fleet utilisation takes the IRR from 13.4% to 1.0%. Price would have to fall by a fifth to do equivalent damage. The reason is the treadmill: $4 billion of silicon has to be bought every four years whether the fleet is busy or not, and a half-idle fleet still pays for it in full.
Almost nobody discloses utilisation. If you take one operational metric away from this piece, make it that one.
Checking the model against something real
A 55% realisation is the load-bearing assumption in everything above, and I do not like load-bearing assumptions I cannot test. CoreWeave, as it happens, publishes both halves of the ratio.
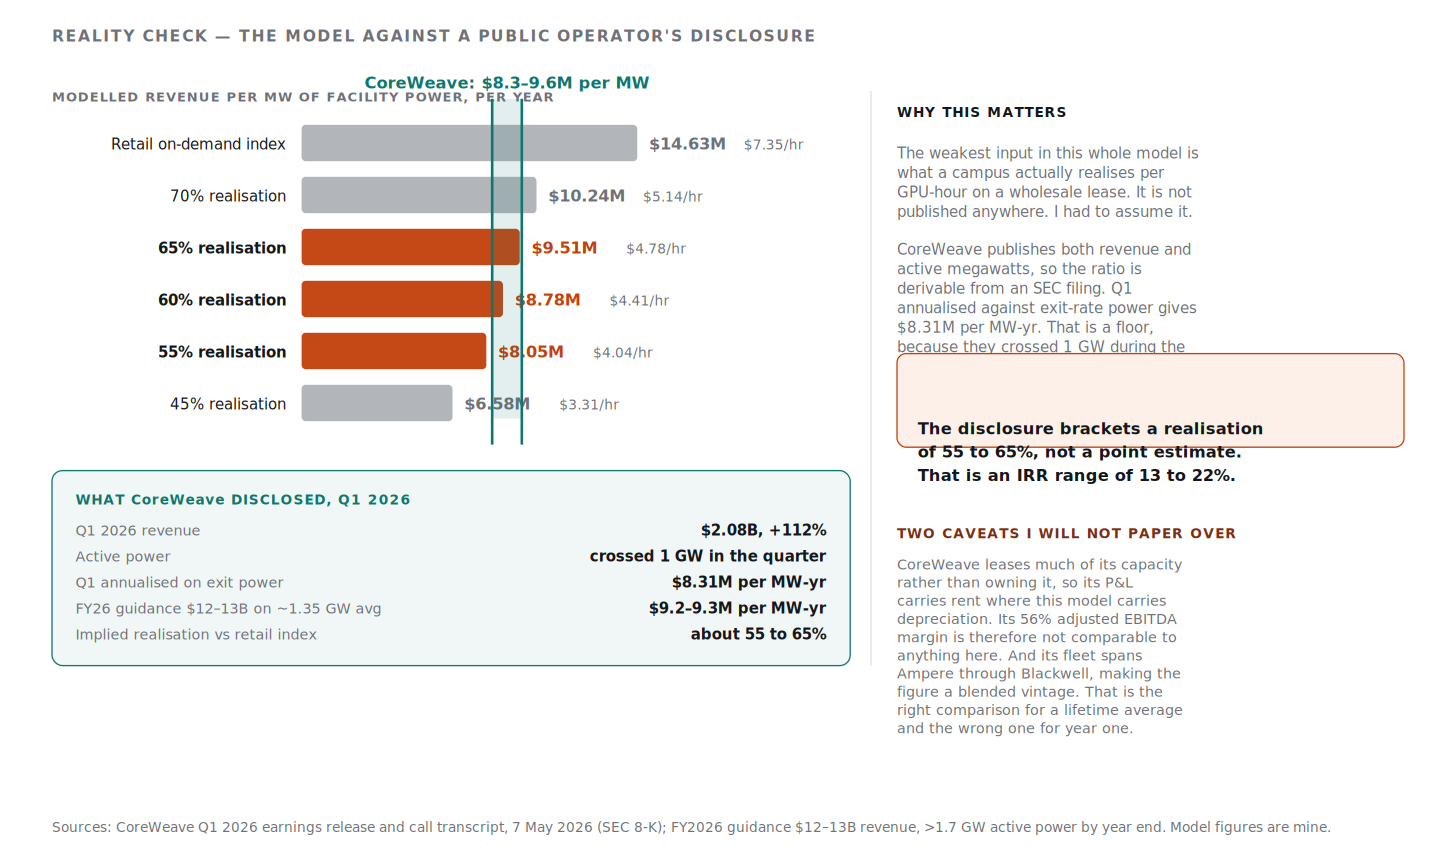
CoreWeave reported $2.08 billion of revenue in Q1 2026, up 112%, and crossed one gigawatt of active power during the quarter. Annualised against that exit figure, revenue runs at $8.31 million per megawatt of active power per year.
Treat that as a floor rather than a midpoint. They crossed a gigawatt during the quarter, so the revenue was earned on a lower average base and the true figure per active megawatt is higher. Full-year guidance of $12 to $13 billion, against a ramp from 1.0 to more than 1.7 gigawatts, implies about $9.3 million.
My model produces $8.05 million per megawatt at a 55% realisation and $9.51 million at 65%. So the disclosure brackets a realisation of 55 to 65% of the retail index, which is an IRR range of 13 to 22% rather than the single 13.4% figure. I have kept 55% as the working assumption throughout because it is the conservative end, and because the honest position is a range.
Two things that check does not do, and I would rather say them than have someone else. CoreWeave leases a large share of its capacity rather than owning it, so its income statement carries rent where my model carries depreciation. Its 56% adjusted EBITDA margin is therefore not comparable to anything here. And its fleet spans Ampere through Blackwell, so the figure is blended across vintages. That makes it the right comparison for a lifetime average and the wrong one for year one.
What it does do is move the weakest input from assumption to a bounded range anchored on a filing. If you have better wholesale data, you can see exactly which number to replace and what it does to the answer.
One more number from the same filing. CoreWeave guides to $31 to $35 billion of capex this year against $12 to $13 billion of revenue, having raised the capex range mid-year. Capex is running at more than two and a half times revenue. That is what the treadmill looks like on a real cash flow statement.
So which depreciation schedule is right?
I said earlier that hyperscalers book five to six years and AI-natives book three, and that both cannot be right. That was too glib. Having worked the decay curve, I think both are right, and the reason is more useful than the dispute.
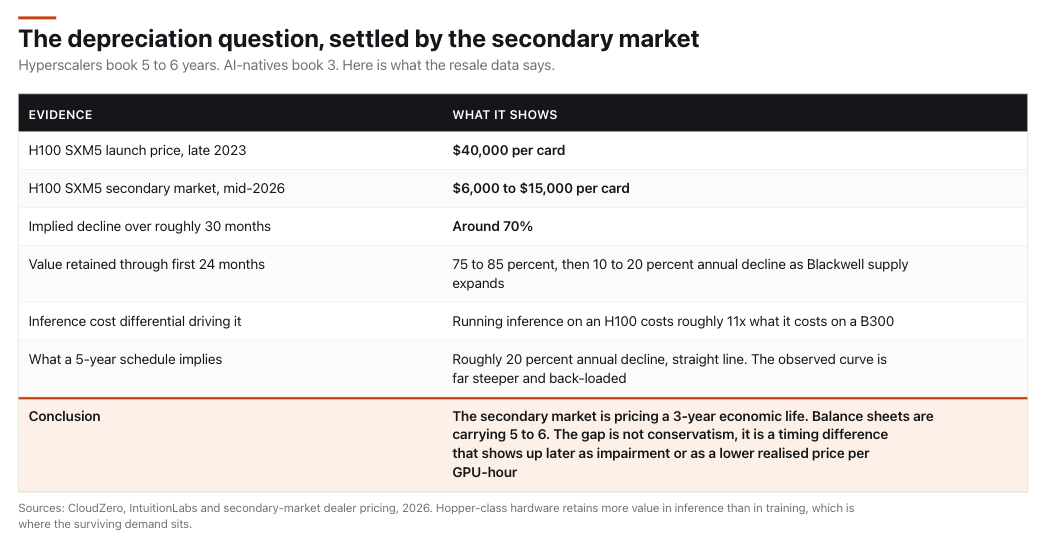
H100 SXM5 cards sold for around $40,000 in late 2023. They move for $6,000 to $15,000 now. Roughly 70% in about thirty months, and the decline is back-loaded: value holds through the first two years, then falls away as the next generation arrives in volume. A five-year straight line implies about 20% annual decline. The observed curve is nothing like that.
The mechanism is not mysterious. Inference on an H100 costs eleven times what it costs on a B300. Once the newer part ships in volume, the older one cannot be priced competitively for the workload that would otherwise keep it busy. The hardware still works. The economics stop.
This is the part I got wrong the first time. That argument is decisive for an operator whose revenue comes from the rental market. It is much weaker for one with internal demand.
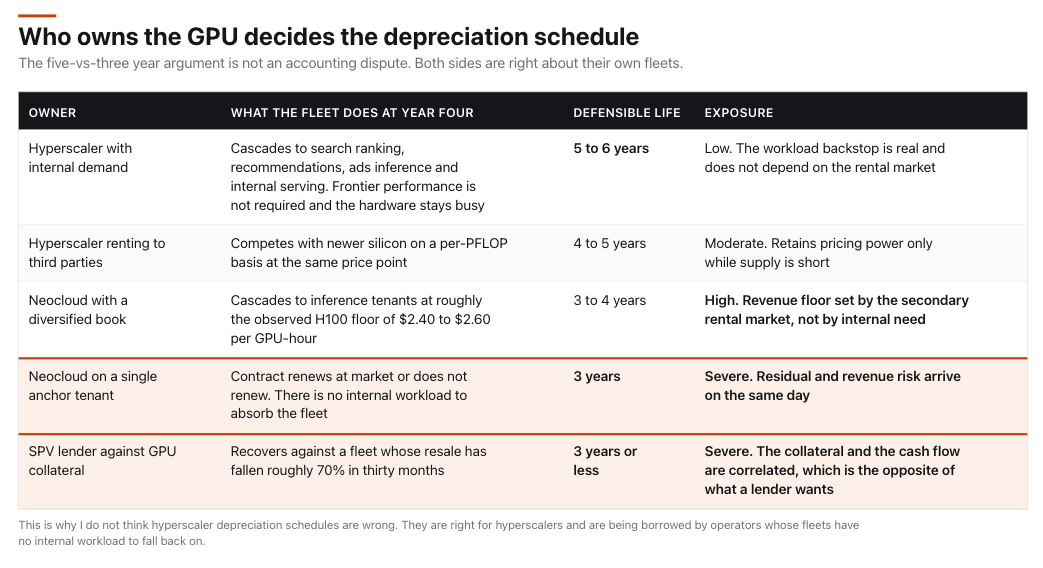
A hyperscaler at year four cascades the fleet to search ranking, recommendations, ads inference and internal serving. None of that needs frontier performance, the hardware stays busy, and a five to six year life is defensible because there is a workload backstop that does not depend on rental pricing at all. A neocloud has no such backstop. Its year-four fleet competes in the open market against the H100 floor of $2.40 to $2.60.
The schedules are not wrong. They are being borrowed. Operators without internal workloads are applying useful-life assumptions that were derived by companies who have them, and lenders are underwriting against the borrowed number. That is a narrower claim than I started with and I think it is the correct one.
How it is financed
Which brings us back to the top. If the revenue-generating asset has a three to four year life, what is the debt behind it?
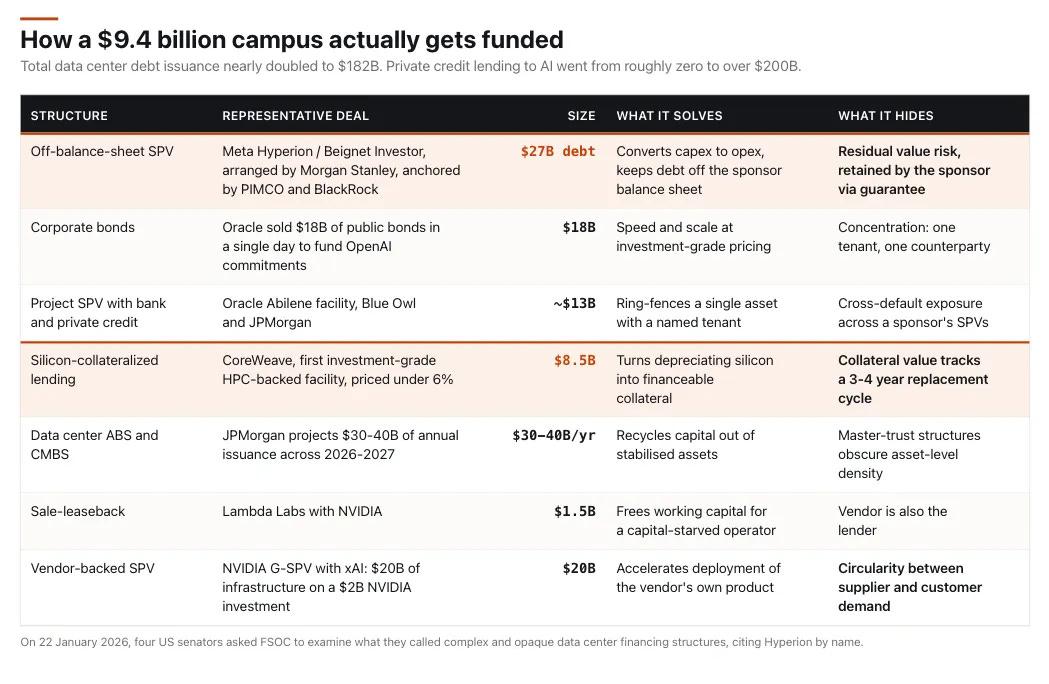
The scale here is easy to miss. Total data center debt issuance nearly doubled to $182 billion. Private credit lending to AI-related companies went from near zero to over $200 billion in a few years, and Morgan Stanley projects another $800 billion over the next two. JPMorgan expects $30 to $40 billion of annual data center securitisation across 2026 and 2027, which would be 7 to 10% of combined CMBS and ABS issuance.
Meta’s Hyperion is the template. A special purpose vehicle called Beignet Investor, arranged by Morgan Stanley, raised $27 billion of A-plus rated debt anchored by PIMCO and BlackRock, plus equity from Blue Owl. Meta keeps operational control, leases the campus back, and converts what would have been capex into predictable opex. The structure is elegant and it is being copied.
Where the money goes
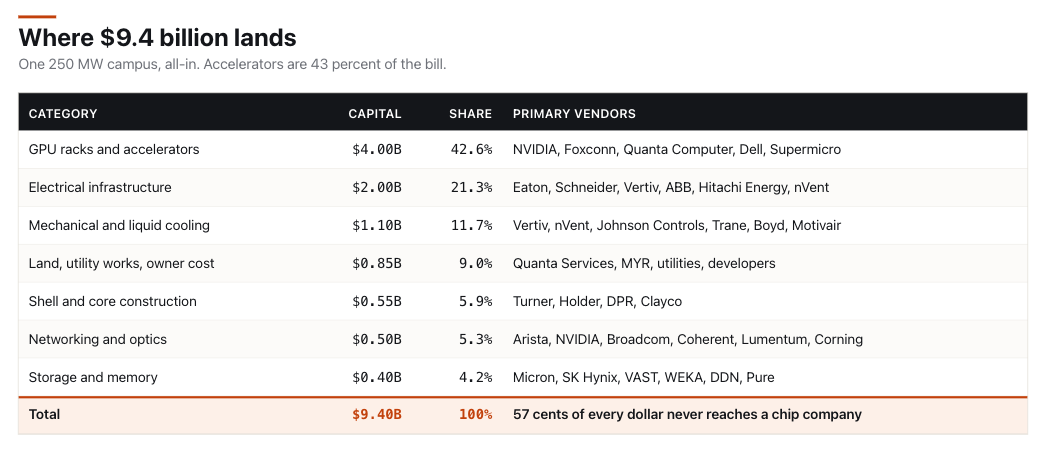
Coverage of AI capex collapses almost entirely to accelerators. Accelerators are 43% of the bill. The other 57% goes to a supply base with multi-year backlogs and, for the first time in decades, real pricing power.
Contractor backlogs are the highest-quality real-time data in the sector, because backlog is signed contract booked 12 to 24 months before revenue. Comfort Systems ended June with $14.06 billion against $8.12 billion a year earlier. Same-store went from $8.12 to $13.70 billion. Q2 revenue up 50%, EPS up 92%, operating cash flow over a billion in a single quarter. Three straight quarters of same-store backlog growth above a billion, with duration running into 2027 and 2028.
On the multiples: Vertiv at 44 times forward is the purest expression of the thesis and leaves no room for a guidance miss. Eaton at 30 times looks slower only because data center is a minority of a very large book, so the 240% order growth is the more useful number. Comfort Systems and EMCOR trade on contractor multiples against utility-like visibility, and that is the clearest dislocation in the group. It is also the most exposed if conversion slips.
The portfolio implication is the part I keep coming back to. The suppliers to the physical layer have this pointed the right way round. They sell into a fifteen-year asset, they book backlog that converts over 12 to 24 months, and they carry no residual risk on the silicon. The operators and the neoclouds carry all of it. Owning the picks and shovels is not just a way to get AI exposure without picking a model winner. It is a way to be long the buildout while short the specific thing that makes the buildout fragile.
How this breaks
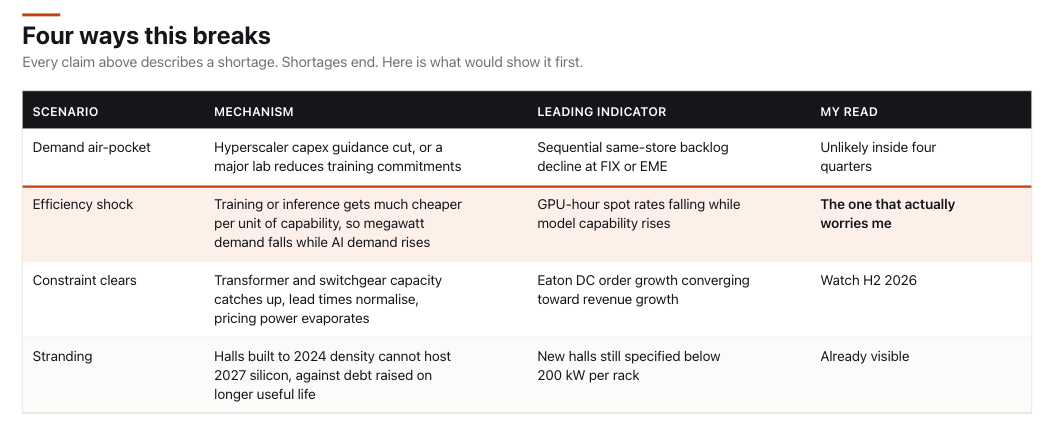
The efficiency shock is the one I actually worry about, not because it is likely on any particular timeline but because it is the only scenario where demand for megawatts falls while demand for AI rises. Nobody in this supply chain is positioned for that. Everything else on that list is a timing risk.
A demand air-pocket in the next four quarters is the one I take least seriously, and the backlog data is why. You cannot quietly cancel $14 billion of signed mechanical contracts. The contractors would report it before the hyperscalers guided to it.
The scenario the table understates is slower and duller. No collapse, just utilisation drifting into the low 70s while depreciation gets marked toward the secondary market. On the model above that combination takes the IRR from 13.4% to about 1% without a single dramatic headline, and it lands on the operators carrying SPV debt rather than on the suppliers.
What to watch
Everything in this piece reduces to a small number of things you can actually watch.
What this actually is
This gets framed as a software story funded by capital markets. It is closer to a heavy industrial construction story with a chip company at one end and a utility at the other, running through a supply chain that spent twenty years optimising for a demand curve that no longer exists.
Fifty-seven cents of every dollar in that $9.4 billion never reaches a semiconductor company. It goes to transformers with three-year lead times, switchgear sold out through 2028, chillers and CDUs and two hundred tonnes of copper busbar, and about 2,500 people spending two years on a site in Ohio or Louisiana turning capital into megawatts.
A gigawatt costs $37.6 billion, takes six and a half years, and 57 cents of every dollar of it is transformers, switchgear, chillers, copper and labour. That physical plant is the durable half. It costs 63 cents an hour to run, it lasts fifteen years, and nobody can build it quickly. The problem is that it is financed on the strength of revenue from the other half, which turns over five times before the paper matures and loses most of its pricing power inside each turn.
At the realisation rate CoreWeave’s own disclosure implies, the campus returns 13.4% and everyone is fine. At 70% utilisation it returns 1%. The distance between those two outcomes is not a market crash. It is an ordinary year with some idle capacity.
The buildings will be fine. Watch who is holding the silicon.
I’d love to connect. I’m an advisor at an AI infrastructure company and we are doing some pretty cool things.
Thanks for the detailed explanation!