


In brief:
One Blackwell GPU costs Nvidia roughly $6,400 to build — 45% of that is HBM memory alone — and sells for $30,000–$40,000. The 5–6x gap between those two numbers, captured entirely at the design layer, is the single clearest illustration of where value in this stack actually accrues.
Six buyers (Microsoft, Amazon, Alphabet, Meta, Oracle, CoreWeave) will deploy over $760B of capex in 2026, up from $410B in 2025 — but margin capture is concentrated in five chokepoints: chip design (Nvidia, 75% gross margin), foundry (TSMC, 66%), lithography (ASML, 53%), memory (SK Hynix/Micron, 70–85%), and networking (Arista/Broadcom, 62–77%).
Assembly and rental — Dell (11% op. margin), Supermicro (8% gross), CoreWeave (6% op. margin) — capture almost none of it despite growing revenue 106–346% year-over-year.
HBM memory’s 70–85% margins are real but cyclical, not structural — a formal scoring framework below puts it at 10/15 on durability, versus 13–15/15 for Nvidia, TSMC, and ASML. DRAM contract prices are up ~820% year-over-year into 2026, the steepest spike in at least three prior four-year memory cycles, and NAND spot prices have already fallen below contract prices — a classic early crack that has historically preceded a cycle turn.
CoreWeave’s capex-to-revenue ratio exceeds 250%, financed substantially with debt — a materially different risk profile than hyperscaler capex funded by 37–46% operating margins on an already-profitable core business.
Inference cost per token has fallen ~99.7% since 2023, yet hyperscaler capex is up 77% in 2026 alone — the DeepSeek shock of January 2025 (Nvidia’s largest one-day market-cap loss in history) tested the “efficiency kills demand” thesis in real time and it failed; Jevons paradox, not substitution, has governed this cycle so far.
Verdict: overweight the durable-moat tier (Nvidia, TSMC, ASML, Arista, hyperscale cloud); trade, don’t hold, HBM memory; avoid or underwrite carefully the commodity-assembly and neocloud tier.
Thesis
Roughly $760 billion of hyperscaler and neocloud capital expenditure will move through the AI infrastructure stack in 2026 — Microsoft, Amazon, Alphabet, Meta, Oracle, and CoreWeave alone. Add Stargate, sovereign AI programs, and enterprise on-prem buildouts, and the gross figure clears $1 trillion. Almost none of this is evenly distributed. It concentrates in a handful of chokepoints — one lithography company, one foundry, three memory makers, two networking suppliers, one cooling specialist — and it evaporates almost entirely by the time it reaches the companies bolting the boxes together and renting out the racks.
The closest historical analogue is the late-1990s fiber-optic buildout: enormous, demand-justified capital investment in physical infrastructure, a handful of equipment suppliers who captured durable value (Cisco), and a much larger population of network operators who overbuilt capacity, took on debt to do it, and were largely wiped out or absorbed when the financing cycle turned — even though the underlying thesis (the internet would need vastly more bandwidth) was completely correct. The lesson from that cycle was never “don’t invest in the buildout.” It was “know which layer of the buildout you own.” The cloud capex cycle of 2010–2020 offers the more benign counter-example: AWS, Azure, and Google Cloud absorbed a decade of heavy infrastructure capex and came out the other side as some of the highest-margin software franchises in history, because the demand side (enterprise workload migration) proved durable enough, and the supply side concentrated enough, that scale itself became the moat. This piece is, in effect, an attempt to sort every company in the current AI buildout into one bucket or the other before the cycle answers the question for us.
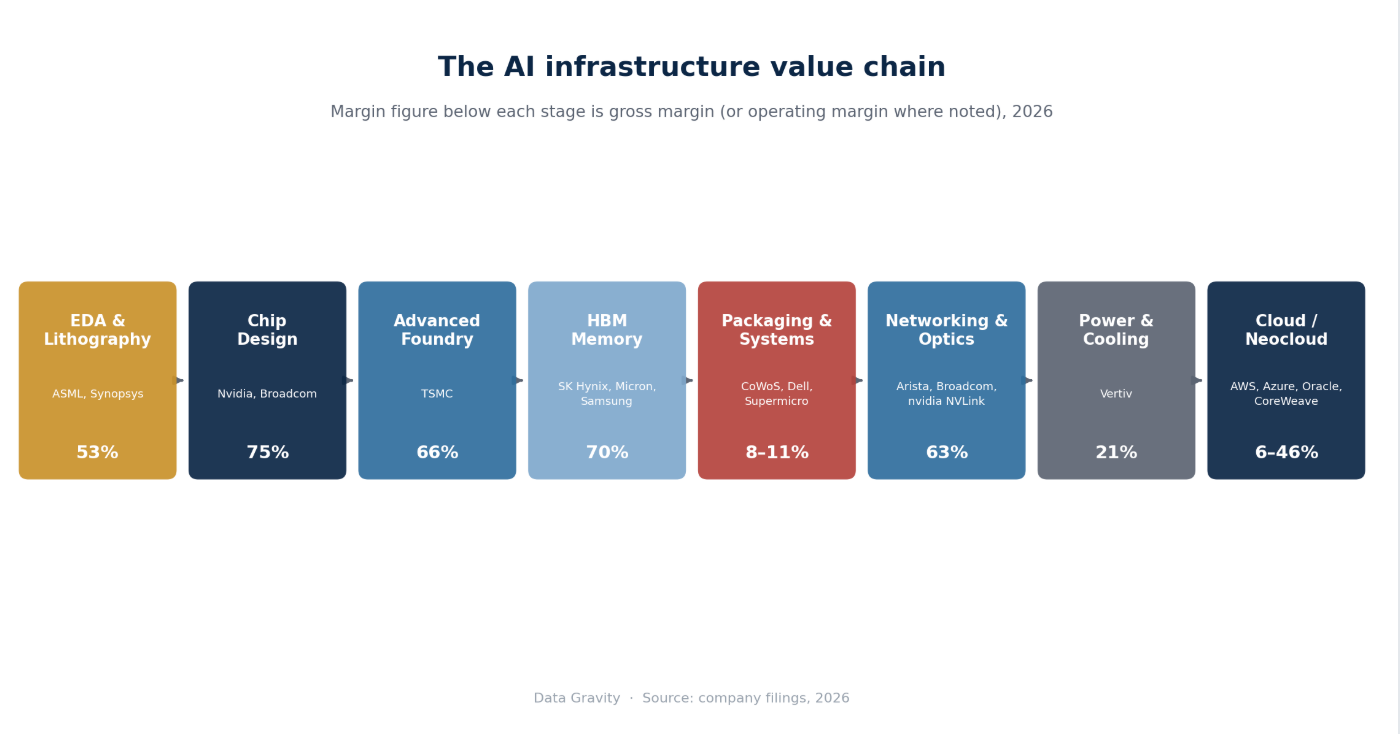
This is the central fact of the AI buildout that market-map slides obscure: value capture in this stack is not correlated with dollars flowing through a layer — it’s correlated with how replicable that layer is. Nvidia converts 75 cents of every revenue dollar into gross profit. Dell converts eleven. Both are “AI infrastructure companies.” They are not remotely the same business.
The physical constraint underneath all of this is increasingly power, not capital. U.S. data center power demand is projected to climb from 31 gigawatts in 2025 to 41 GW in 2026 and 66 GW in 2027 — more than doubling in two years — while global data center power demand rises 27% in 2026 alone, from 104 GW to 132 GW, en route to a projected 290 GW by 2030. U.S. data centers’ share of peak summer electricity demand is set to nearly double, from 4.1% in 2025 to 8.5% by 2027. Every company in this piece is, at some level, racing against a grid buildout that moves on a slower clock than capital markets do — which is precisely why Vertiv’s backlog and the broader power/cooling layer matter more than their market cap alone suggests.
The rest of this piece works through the stack layer by layer, with the 2026 numbers, to build a durable mental model for where profit pools sit today and which of them survive the next three to five years of capacity build.
The Stack by Market Value
Before getting into margin structure, it’s worth seeing the stack the way public markets currently price it. The dispersion is extreme: Nvidia alone is worth more than the bottom eleven companies in this piece combined.
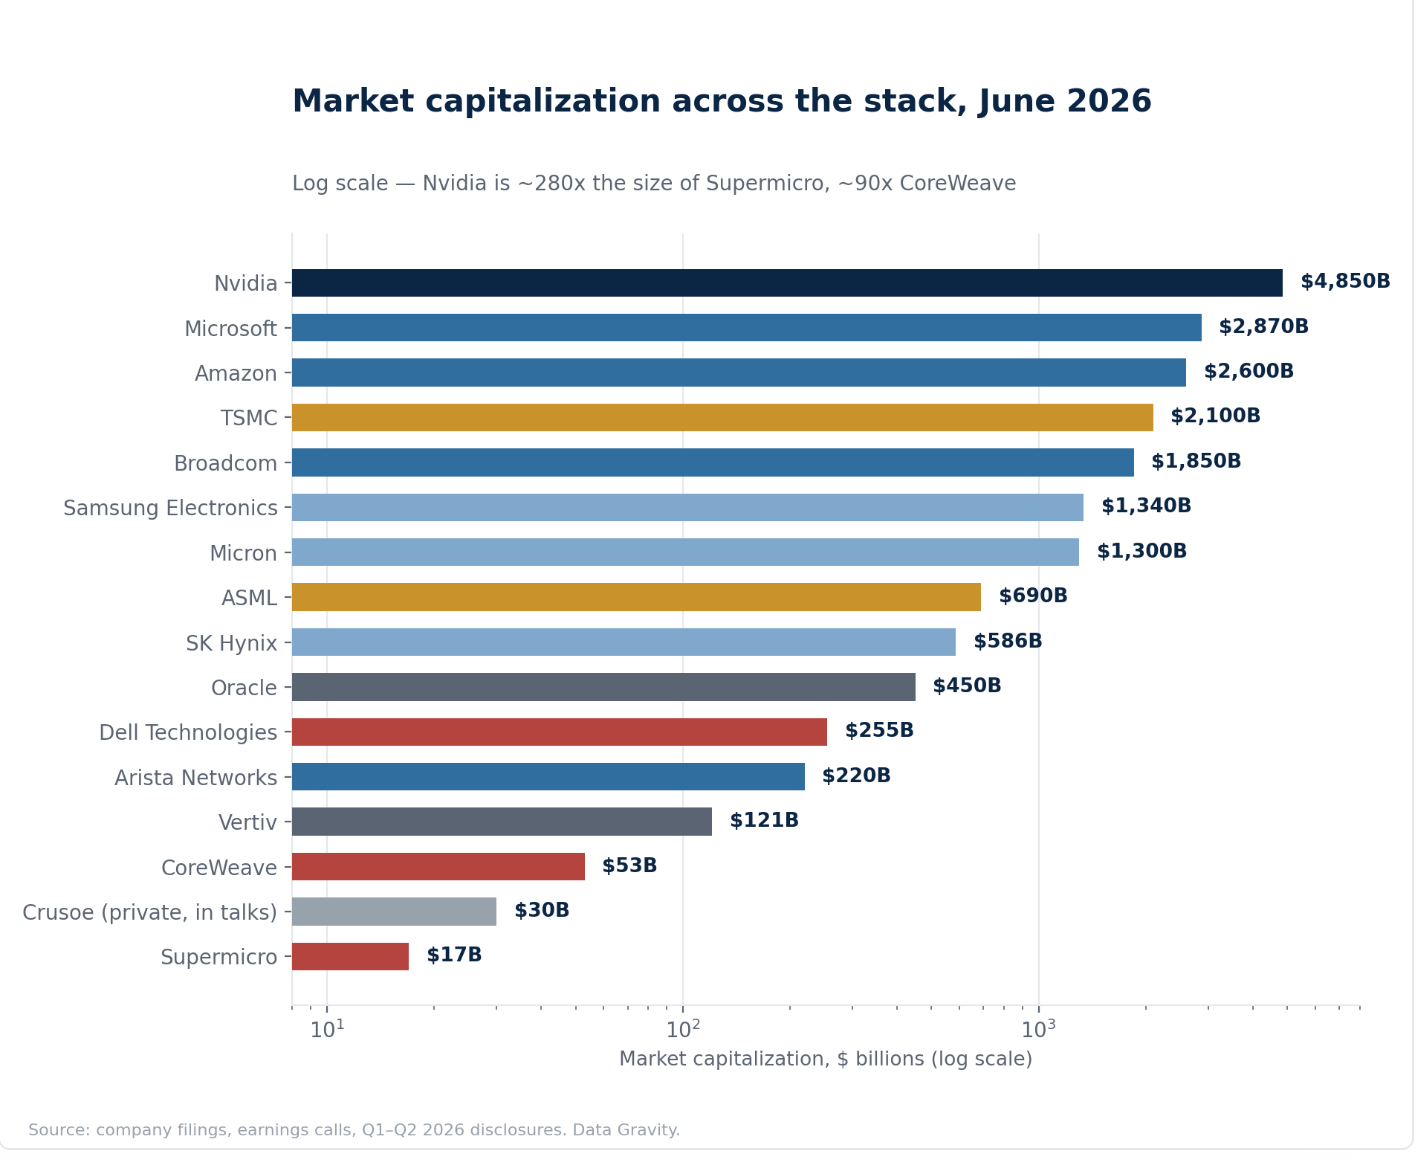
Three things stand out. First, the design and foundry layers (Nvidia, TSMC) and the hyperscale cloud layer (Microsoft, Amazon) account for the overwhelming majority of aggregate value — over $12 trillion combined among just four companies. Second, the memory names (Micron, Samsung, SK Hynix) have re-rated dramatically over the past twelve months on the back of the HBM cycle, with Micron alone now larger than ASML despite a much shorter history of sustained profitability. Third, and most tellingly for anyone doing bottom-up diligence in this sector, the assembly and neocloud tier — Dell, Supermicro, CoreWeave, Crusoe — trades at a small fraction of the value of the layers directly above and below it in the physical supply chain, despite processing enormous and growing volumes of capital. The market has already priced the framework this piece is describing; the question is whether it has priced it correctly for what comes next.
How Big Does This Get
Sizing estimates for the buildout vary by scope but agree on direction and magnitude. Goldman Sachs’ baseline model implies $765 billion of annual AI capex in 2026, scaling to $1.6 trillion annually by 2031. McKinsey puts total data center capital requirements at $6.7 trillion through 2030, of which $5.2 trillion is AI-specific — roughly 70% of all data center capacity built over the rest of this decade will be AI-driven. Morgan Stanley’s more conservative frame estimates nearly $3 trillion of AI infrastructure investment flowing through the global economy by 2028, with more than 80% of that spending still ahead of it, and has separately floated a $40 trillion figure for the total economic value AI diffusion could eventually create — a number that dwarfs the infrastructure capex required to enable it by roughly an order of magnitude.
What matters isn’t which estimate is right. It’s that every credible forecast has AI infrastructure spending compounding through at least 2030, off a base that has already tripled in three years. That is the demand backdrop against which every margin and moat argument in this piece has to be read. The layers with pricing power aren’t betting on a spending peak arriving soon — they’re pricing a multi-year runway, and the sell-side keeps revising its own numbers up, not down.
The Efficiency Paradox
The best objection to this whole piece isn’t about any one company. It’s macro: if AI intelligence is getting radically cheaper, why does infrastructure spending keep accelerating? That question already got tested in the real world, so here’s what actually happened.
In January 2025, Chinese lab DeepSeek released a model claiming frontier-class performance trained for a reported $5.6 million — a figure that, whatever its precision, was low enough to detonate the market’s assumptions about compute intensity. Nvidia lost $589 billion of market capitalization in a single trading day, the largest one-day value destruction of any company in history, on the fear that “great angst as to the impact for compute demand” (Cantor’s phrasing at the time) meant peak GPU spending had arrived early. Eighteen months later, Nvidia’s market cap sits at $4.85 trillion — more than 8x its post-DeepSeek trough — and combined Big Four hyperscaler capex has gone from $410 billion (2025) to a guided $725 billion (2026), a 77% increase in the same window the market once feared would mark the top.
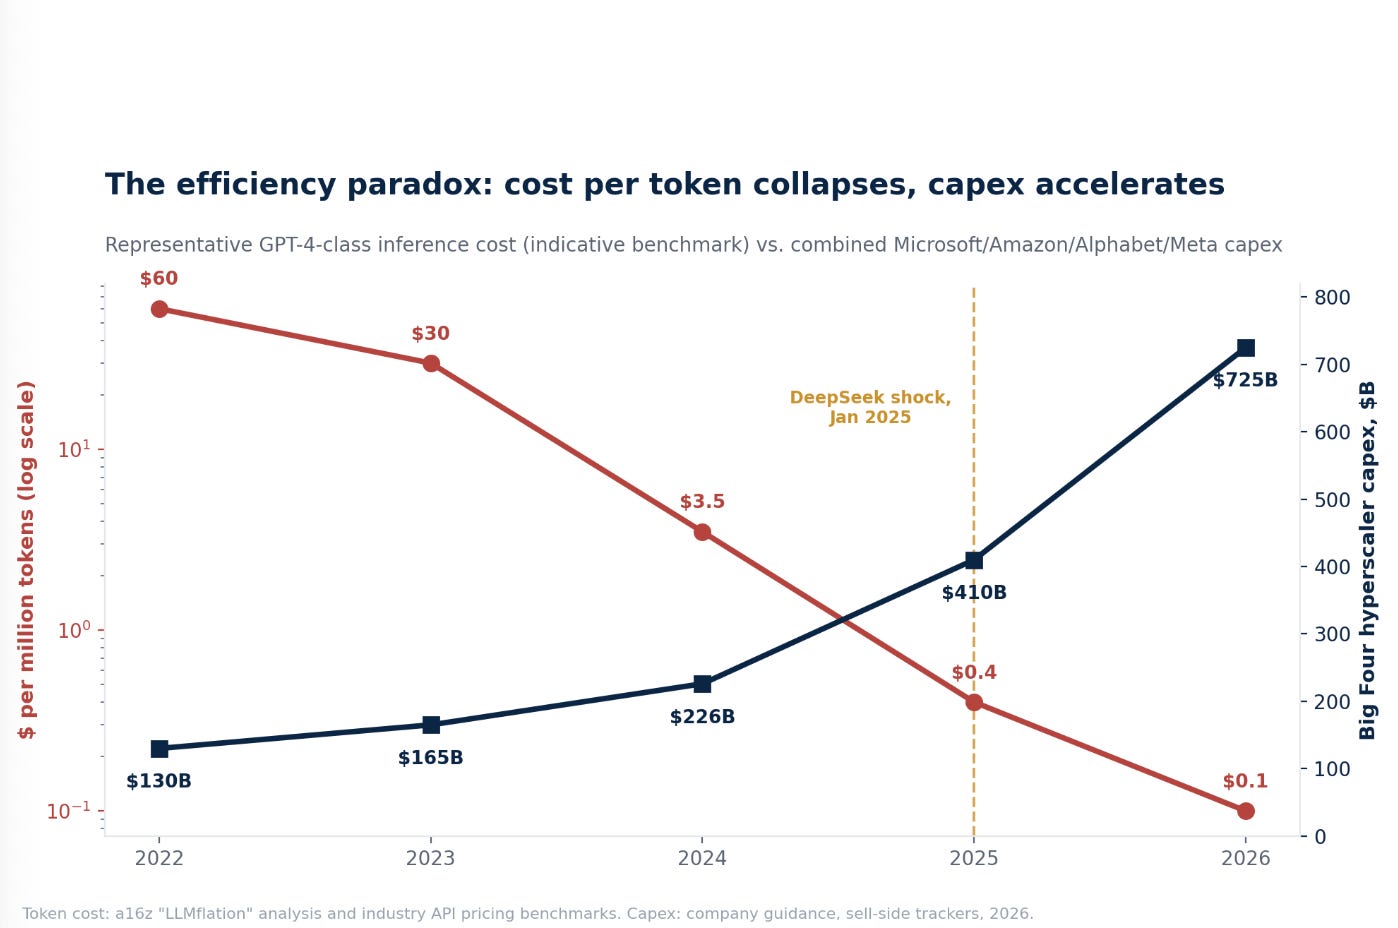
The token-cost side of that chart is dramatic on its own terms. a16z’s “LLMflation” analysis and industry API pricing both show GPT-4-class inference falling from roughly $30 per million tokens at launch (March 2023) to under $0.10 per million tokens for equivalent capability by 2026 — two orders of magnitude in three years, faster than PC compute or dot-com-era bandwidth cost declines historically ran. That’s one of the fastest unit-cost collapses of any general-purpose technology on record. Capex rose anyway, at an accelerating rate, in the same window.
The answer is Jevons paradox, playing out about as cleanly as it ever has: when the cost of something useful falls, people use so much more of it that total spending rises even as the unit economics collapse. Morgan Stanley Research puts a precise shape on how this plays out over the rest of the decade: the AI infrastructure TAM grows from roughly $315 billion in 2025 to nearly $1 trillion by 2030, and within that growth, inference compounds at a 42% CAGR between 2025 and 2030 versus a materially slower rate for training — enough to flip the mix from training-majority today (roughly 75% training / 25% inference in 2025) to inference-majority
by the end of the decade (56% inference / 44% training in 2030).
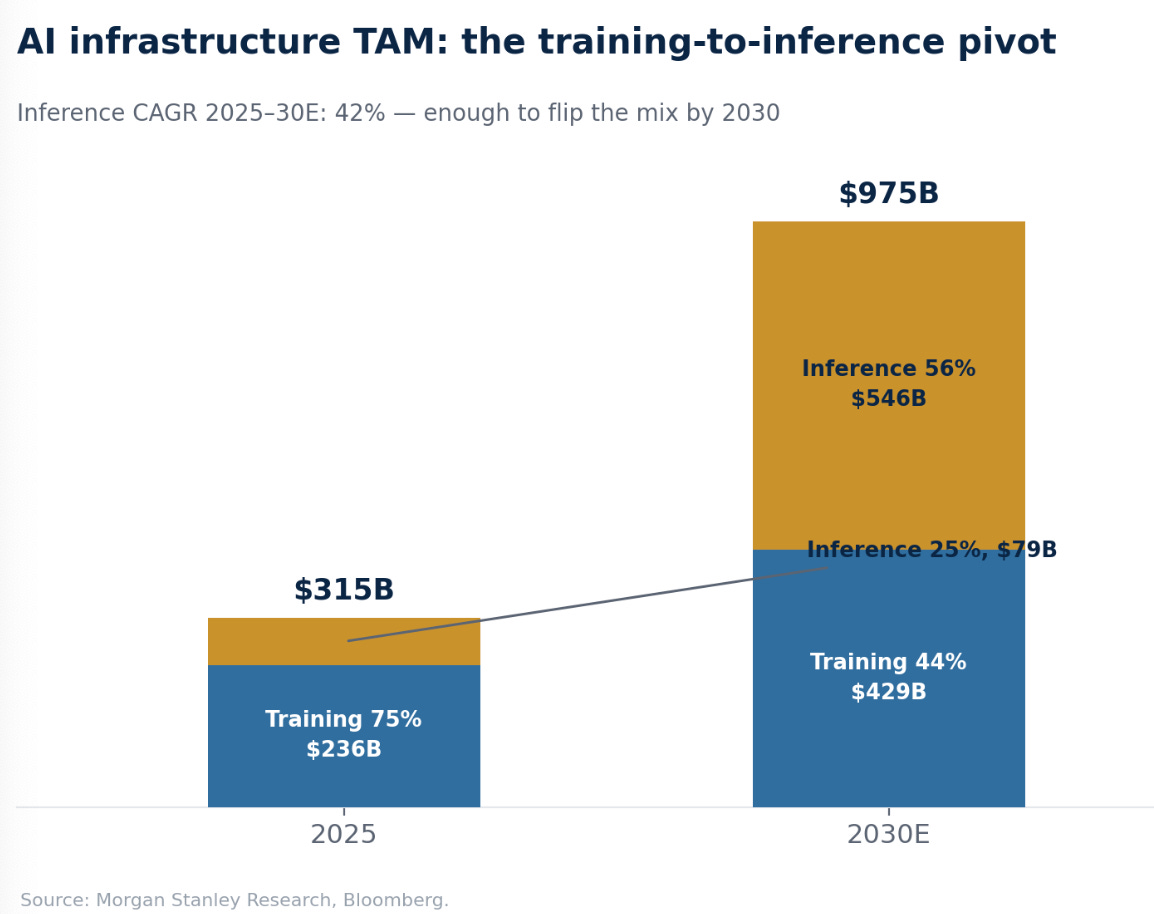
Training doesn’t shrink in absolute terms — it keeps growing, from $236 billion to a projected $429 billion — it simply stops being the terminal use case. Inference, priced per query at a small and falling fraction of its 2023 cost, becomes the larger and faster-compounding half of the market anyway, because there are vastly more queries than there are training runs, and grows nearly seven-fold ($79 billion to $546 billion) over the same window. That shift favors the durable-moat and hyperscale-cloud tiers over a pure training-compute thesis, because inference workloads are more distributed, more latency-sensitive, and — importantly for Broadcom’s and the custom-silicon cohort’s argument — more receptive to purpose-built, less flexible, cheaper-per-query silicon than training workloads ever were. The efficiency curve is real and it’s fast, and so far it has accelerated demand rather than killed it, for every layer in this stack except the ones already flagged as weak below.
Scarcity Sets the Margin, Not the Spend
Every layer in this stack is growing. Growth isn’t what separates the winners — margin structure is. The pattern repeats at every node of the chain.
Layers with structural scarcity — a single supplier, a multi-year lead time to add capacity, or an entrenched software/IP moat — hold gross margins of 60–85% almost regardless of end-demand volatility. Layers that are capital-absorbing but replicable — assembly, integration, undifferentiated compute rental — get bid down to single-digit or low-teens margins the moment more than one credible competitor shows up with a checkbook.
Nvidia (chip design), TSMC (advanced foundry), ASML (EUV lithography), and the HBM oligopoly (SK Hynix, Samsung, Micron) all sit in the first category. Dell, Supermicro, and the neoclouds (CoreWeave, Crusoe) sit in the second. Networking (Arista, Broadcom) and power/cooling (Vertiv) sit in a durable middle tier: real engineering moats and real pricing power, but smaller absolute scale than the chip or foundry layers.
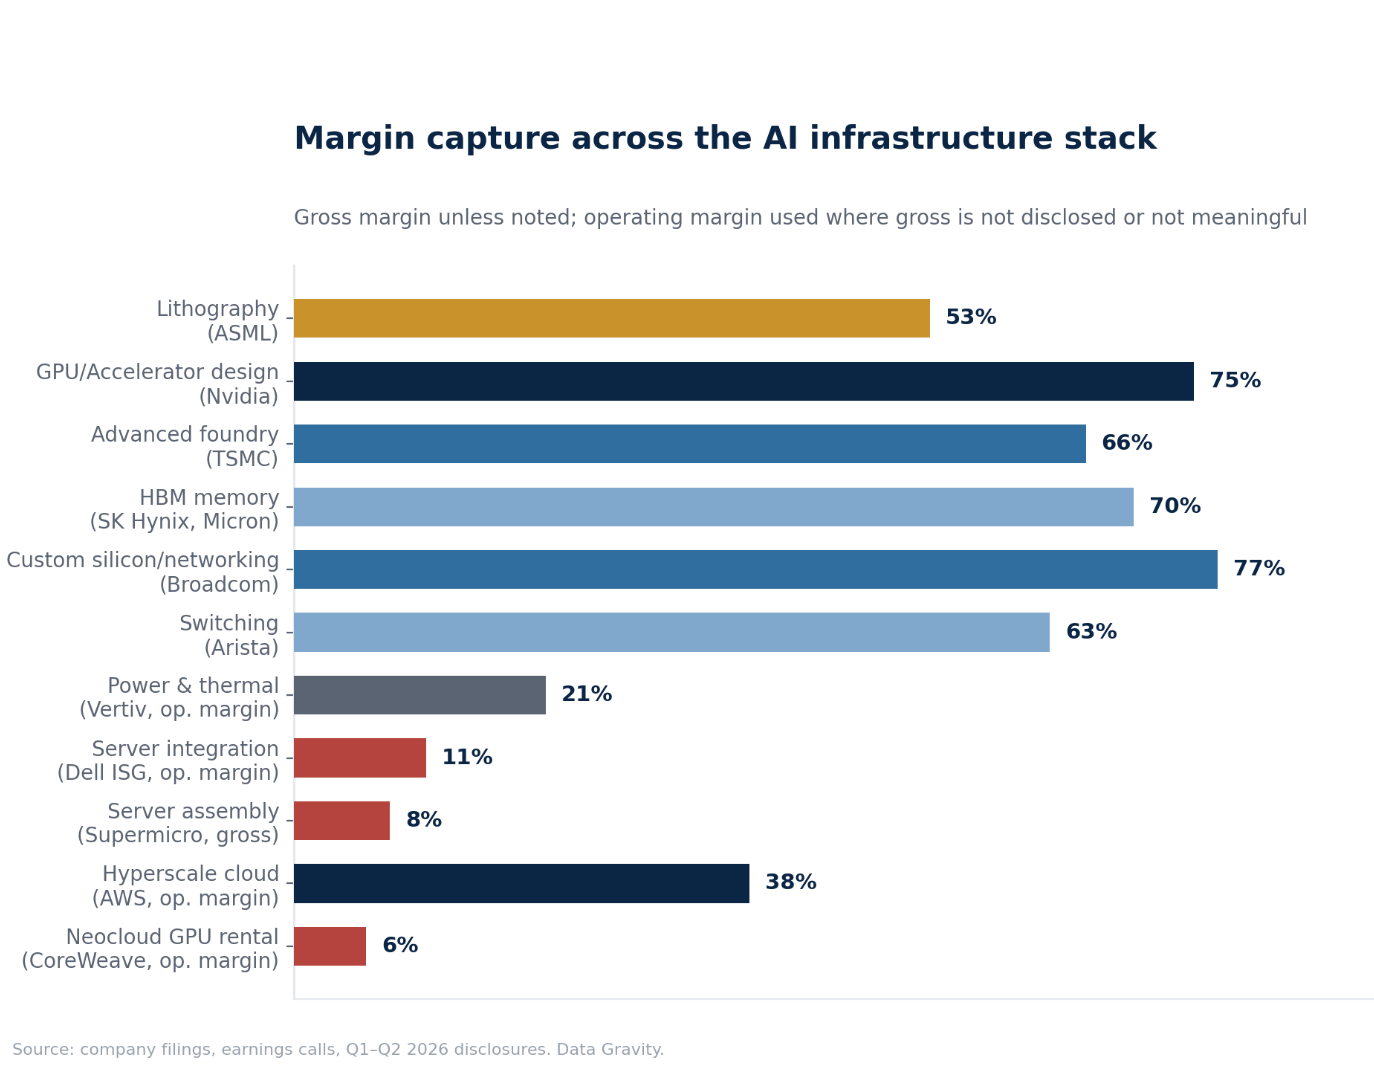
That spread is the real story. A 12-point gap between the top of the stack (77% gross margin at Broadcom’s custom silicon business) and the bottom (6% operating margin at CoreWeave, 8% gross margin at Supermicro) isn’t noise. It’s the market pricing scarcity correctly, layer by layer, in real time.
To make that judgment reproducible rather than impressionistic, score every layer on the three factors that actually determine whether a margin survives a capacity cycle: supply scarcity (how many credible suppliers exist today), switching cost / IP moat (what it costs a customer to leave), and capital intensity as a barrier (whether the capex required to enter is itself a deterrent, or merely a checkbook problem for a well-funded entrant). Score each 1 (weak) to 5 (strong) and the ranking falls out of the arithmetic rather than the narrative.
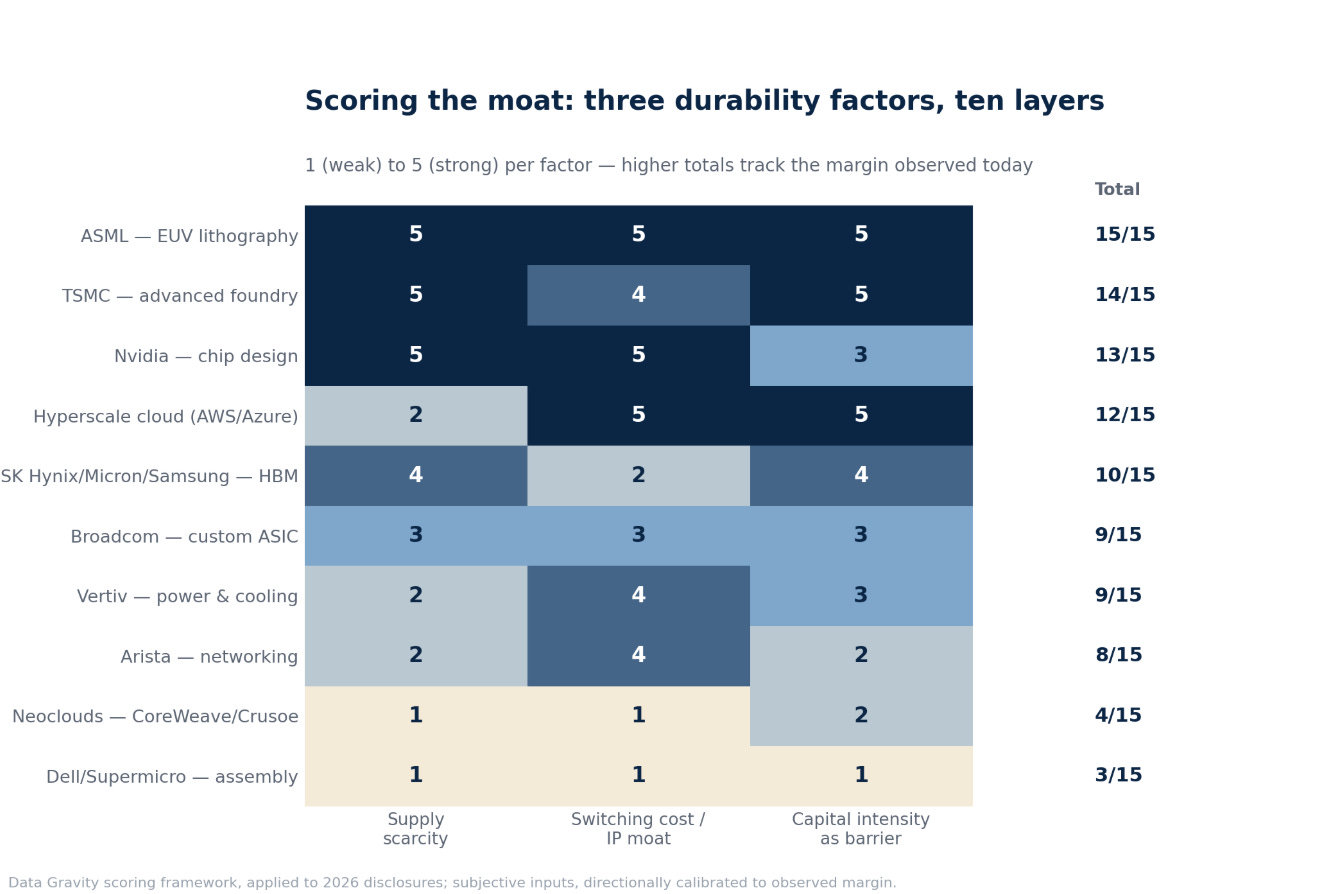
Two results cut against the size-based intuition of a market-cap ranking. First, HBM memory scores a 10/15 — respectable, but nearly three points below Nvidia and five below ASML — because its switching-cost score is only a 2: HBM is a qualified, multi-sourced commodity component, and a hyperscaler buying HBM3E today is not locked into SK Hynix the way it is locked into CUDA. Second, hyperscale cloud outscores Nvidia’s design layer on switching cost and capital intensity (5 and 5, versus Nvidia’s 5 and 3), a reminder that Nvidia’s moat is almost entirely a scarcity-and-software story, while AWS and Azure’s moat is scarcity-light but capital- and switching-cost-heavy. Both produce durable margin, but through different mechanisms — which matters for how fast each moat could erode, and under what conditions.
Layer 1 — Design
Nvidia earns roughly 75% gross margin. Dell earns 11% operating margin on its AI servers. Every allocator eventually asks why, and the answer is structural, not incidental.
Nvidia reported Q1 FY2027 (quarter ended April 2026) revenue of $81.6 billion, up 85% year-over-year, with data center revenue of $75.2 billion, up 92%. GAAP gross margin was 74.9%. Operating income was $53.5 billion — a 65.6% operating margin — and net income was $58.3 billion, up 211% year-over-year, on free cash flow of $48.6 billion. The company’s market capitalization sits at roughly $4.85 trillion, making it the most valuable company on earth.
Nvidia doesn’t manufacture a single wafer. It designs silicon and owns CUDA, the software layer that has absorbed fifteen years of developer tooling, libraries, and institutional muscle memory. That software moat is what lets Nvidia charge a price for the H100/B200/Rubin generations that reflects the value of the entire AI training and inference workflow, not the marginal cost of a chip. Demand exceeds supply at every node TSMC can produce; Nvidia is the scarce resource, and it prices like one.
This scarcity cuts both ways. Nvidia’s own disclosures show four direct customers each representing more than 10% of total revenue in Q3 FY2026 — 22%, 15%, 13%, and 11% respectively, a combined 61% of revenue from four unnamed hyperscaler-scale buyers. That concentration is the natural consequence of selling the scarcest input in the stack to the handful of companies large enough to buy it at scale. But it also means Nvidia’s growth trajectory is now more sensitive to the capital-allocation decisions of four boardrooms than diversified revenue bases usually are — the same four boardrooms, in some combination of Microsoft, Amazon, Meta, and Google, that are simultaneously funding the custom-silicon programs built to reduce that dependency over time.
Dell’s Infrastructure Solutions Group (ISG), by contrast, posted a record $29 billion in Q1 FY2027 revenue with AI-optimized server revenue of $16.1 billion — up 291.7% year-over-year — against an ISG operating margin of just 10.5%, itself up only 80 basis points despite AI server volume growing nearly 800%. Dell closed FY2026 with $64.1 billion in cumulative AI orders and a $43–51 billion AI backlog. The volume is real and enormous. The margin is not moving.
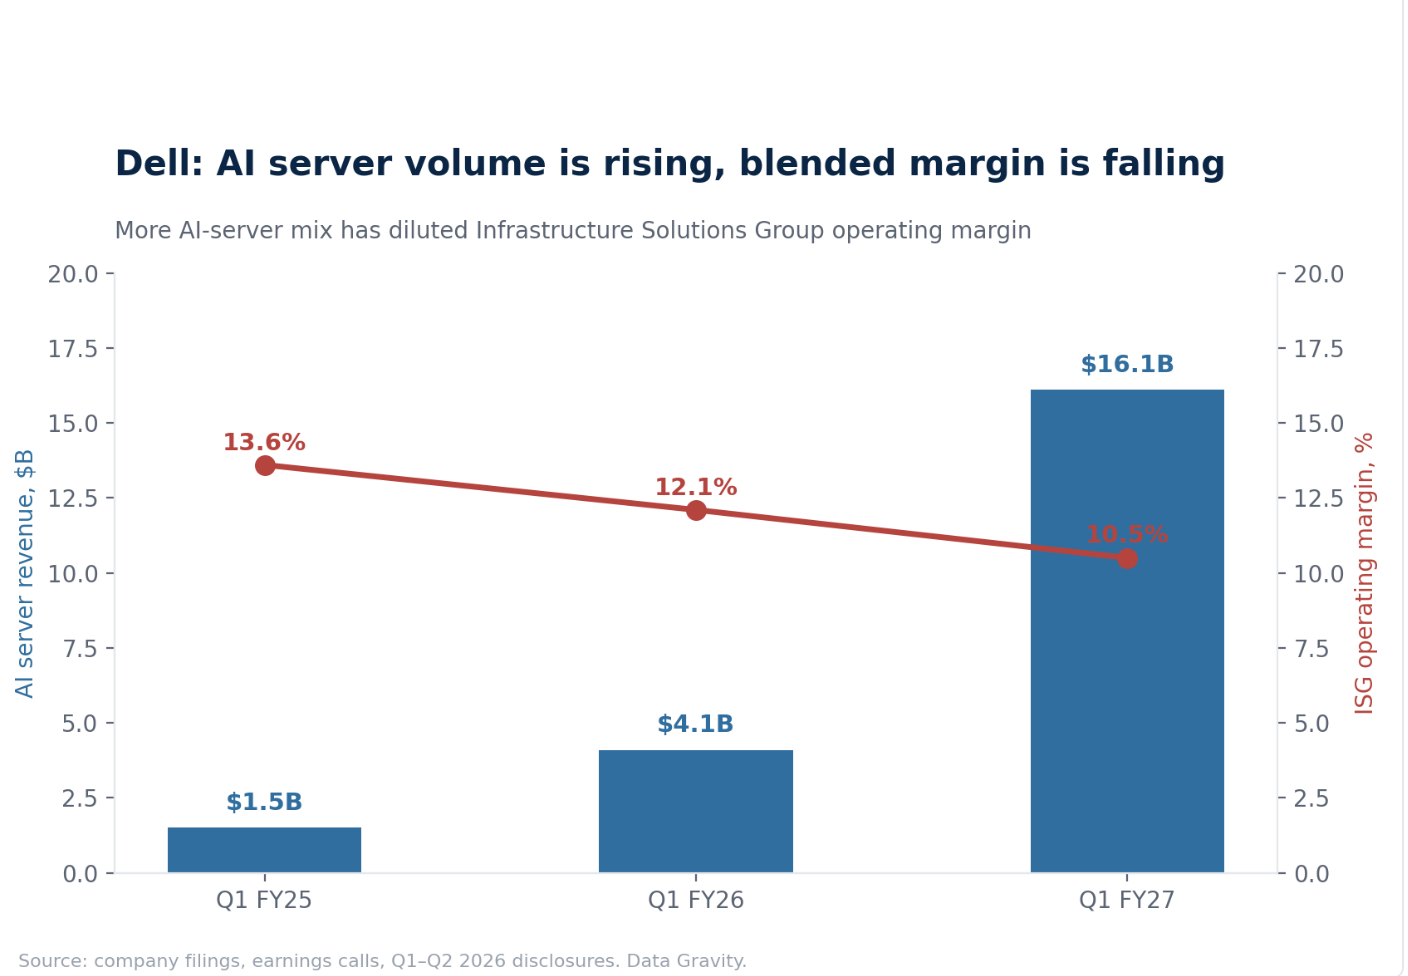
The mechanism is simple: Dell (and Supermicro, whose gross margin has run between 6.3% and 10.1% across recent quarters despite $38.9–40.4 billion in FY2026 revenue guidance) buy the same Nvidia GPU, the same SK Hynix HBM, the same Broadcom NIC that every other integrator can buy, and assemble them into a box. There is no proprietary IP in the assembly step that a customer can’t get from three other vendors within a quarter. Dell and Supermicro are price-takers on their most expensive input (the GPU) and price-takers on their output (the finished server) — squeezed from both sides in a business where the customer, a hyperscaler or enterprise, can and does multi-source.
It’s the cleanest illustration in this whole framework: identical end demand, identical growth rate, radically different margin, because one layer is a monopoly-adjacent software platform and the other is a commodity assembly line.
The clearest way to see this is to follow a single chip from the fab to the rack. Epoch AI’s cost-breakdown analysis puts total manufacturing cost (COGS) for one Blackwell B200 GPU at roughly $6,400 — and within that figure, HBM memory alone is 45% ($2,900), ahead of the logic die itself (22%, $1,400), CoWoS advanced packaging (17%, $1,100), and substrate/testing (16%, $1,000). Nvidia then sells that same GPU for a street price in the $30,000–$40,000 range: a five-to-six-times markup captured entirely at the design layer, on top of a component cost structure in which the memory supplier has already embedded its own 70%+ gross margin before the chip is even assembled.
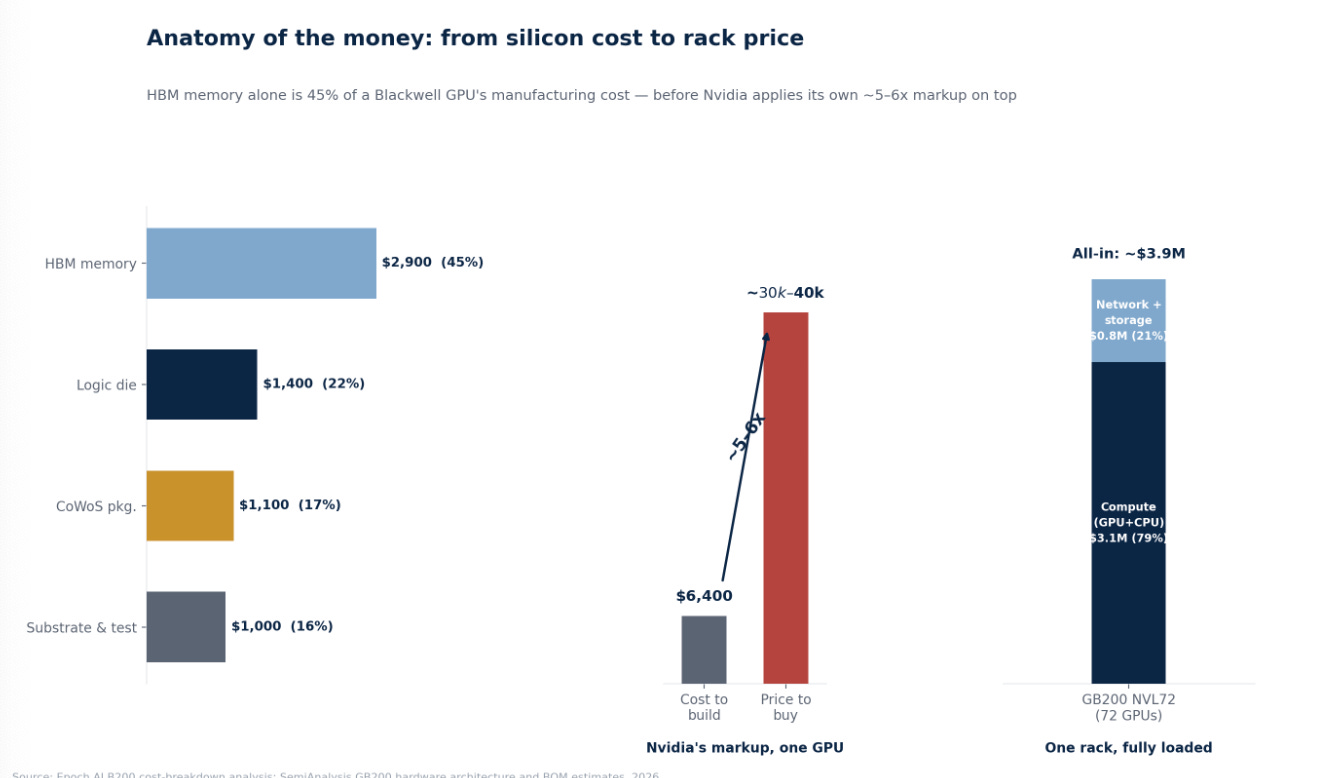
Scale that to a full GB200 NVL72 rack — 72 of these GPUs plus Grace CPUs, NVLink switching, and cooling infrastructure — and the system-level price runs to roughly $3.1 million for the compute portion, $3.9 million all-in once networking and storage are included. Dell or Supermicro’s job is to take that $3.9 million of mostly Nvidia-priced, SK-Hynix-priced, and Broadcom-priced components, add chassis, cabling, integration labor, and a support contract, and mark the whole thing up by single digits. Every dollar of margin in that rack was captured before the box was assembled. Assembly is where margin goes to be spent, not made.
The Layer Beneath the Layer
Nvidia’s 75% gross margin is a hardware number attached to a software moat, and the two are worth separating, because software is the layer in this stack most resistant to every competitive pressure described elsewhere here. CUDA isn’t one product. It’s roughly two decades of accumulated libraries, compilers, and developer tooling (cuDNN, NCCL, TensorRT, and hundreds of downstream frameworks) that make Nvidia silicon the default target for every new model architecture before anything else gets considered. That accumulated software surface is precisely what custom silicon programs at Google, Amazon, and Microsoft have to replicate from a standing start, and why, even with $225 billion of committed Trainium spend, Amazon’s own leadership frames the custom-silicon push as a workload-specific complement to Nvidia dependency rather than outright replacement on any near-term timeline. Beneath CUDA sits a second software layer that gets even less investor attention: the orchestration, scheduling, and cluster-management tooling (Slurm, Kubernetes-based GPU schedulers, Ray) that determines whether a given cluster actually achieves the utilization its hardware spec implies. A cluster running at 55% effective utilization instead of 85% is, economically, a cluster with roughly a third of its capital sitting idle, which makes this orchestration layer, though it captures little margin directly today, one of the more interesting adjacent software opportunities the current buildout is creating.
The strongest bear case on the CUDA moat is worth taking seriously, because it’s the biggest swing factor in whether Nvidia’s design-layer score stays a 13/15 or drifts toward Broadcom’s contested 9/15 over a five-year horizon. PyTorch, the framework most model training now runs through, has spent several years deliberately abstracting away direct CUDA calls behind its own compiler stack (torch.compile, TorchInductor); OpenAI’s Triton language does the same for custom kernel authorship, letting a developer write hardware-agnostic code that can, in principle, target AMD’s ROCm or a custom ASIC’s compiler backend with far less rewrite effort than five years ago. If that abstraction layer keeps maturing, the actual switching cost of leaving Nvidia silicon falls even as CUDA itself stays dominant, because the thing developers depend on stops being CUDA specifically and starts being the compiler layer sitting on top of it. The counter-evidence: this transition has been “underway” for essentially the entire period Nvidia’s data center revenue compounded from single-digit billions to $75 billion a quarter, and every attempted software abstraction to date has still shipped its best-optimized path on Nvidia hardware first. The moat looks real today and slowly eroding at the edges — not collapsing, not permanent — which is why the framework scores it a 5 on switching cost while flagging it as the dimension most likely to move.
Layer 2 — Foundry
TSMC sits at the foundry chokepoint of the stack, and the bottleneck inside it has a name: CoWoS.
TSMC posted Q1 2026 revenue of $35.9 billion, up 40.6% year-over-year, at a record 66.2% gross margin, 58.1% operating margin, and 50.5% net margin. Full-year 2026 revenue is guided to grow more than 30% in USD terms. Market capitalization: roughly $2.1 trillion.
TSMC’s moat isn’t really “advanced lithography” — that’s ASML’s layer, one step upstream. TSMC’s moat is the accumulated manufacturing yield, process know-how, and packaging capacity that no other foundry has matched at volume. The specific chokepoint that determines how much AI silicon can physically reach the market in any given quarter is CoWoS (chip-on-wafer-on-substrate), the advanced packaging process that stitches GPU compute dies to HBM stacks.
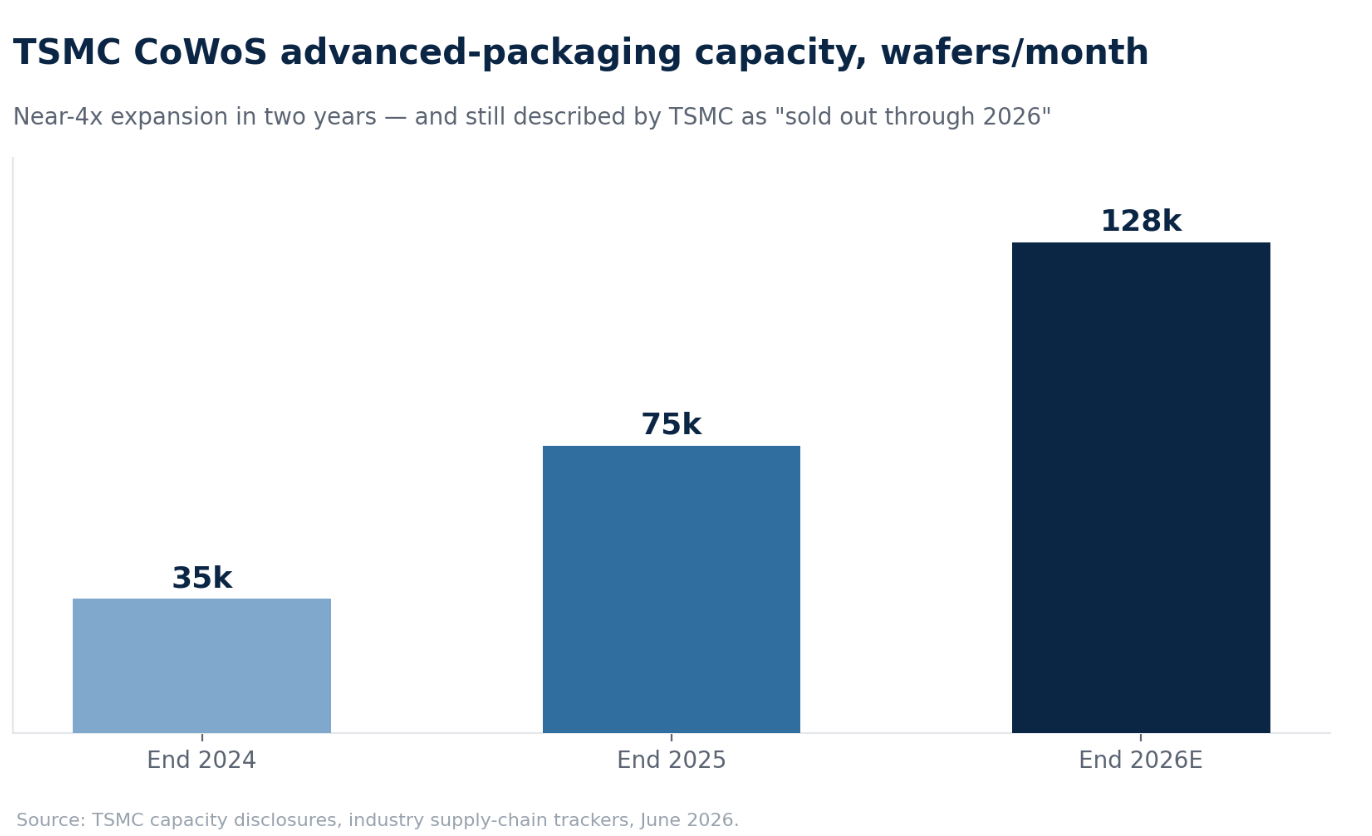
CoWoS capacity has gone from roughly 35,000 wafers per month at the end of 2024 to about 75,000 at the end of 2025, with a target of 125,000–130,000 by the end of 2026 — nearly a 4x expansion in two years. TSMC’s own CEO described the line as “sold out through 2026” as of the company’s June 2026 annual meeting. It’s the most important supply constraint in the entire AI stack: it doesn’t matter how many GPUs Nvidia can design or how much HBM SK Hynix can fab if CoWoS capacity can’t marry the two together. TSMC captures margin here not because it competes on price, but because for the 3-nanometer/2-nanometer AI accelerator category, there is effectively no alternative supplier at scale. Samsung Foundry and Intel Foundry remain multiple process generations and multiple years of qualification behind on both logic and advanced packaging.
The Layer Investors Overlook: Optics
Every GPU cluster large enough to train a frontier model is, physically, an interconnect problem before it’s a compute problem. Copper reaches its practical bandwidth-distance limit within a single rack; everything beyond that — GPU-to-GPU across racks, rack-to-rack across a data hall — runs over optical transceivers. As cluster sizes have scaled from thousands to hundreds of thousands of GPUs, the optics bill of materials per cluster has scaled with it: a single large training cluster today consumes hundreds of thousands of 800G and increasingly 1.6T optical transceivers, a cost line that barely existed at this scale three years ago. This is a growing profit pool, occupied by transceiver and silicon-photonics suppliers sitting adjacent to Broadcom’s and Arista’s networking businesses, and it’s also a genuine physical bottleneck: optics manufacturing capacity, like CoWoS, cannot be added instantly, and a shortage here caps effective cluster size regardless of how many GPUs and how much HBM are sitting in inventory. It’s the least-discussed chokepoint in this entire stack relative to how much it actually matters.
Layer 3 — Lithography
One step further upstream sits ASML, the Dutch company that is the sole global supplier of EUV (extreme ultraviolet) lithography systems — the machines TSMC, Samsung, and Intel all need to print anything below the 7nm node. ASML’s Q1 2026 net sales were €8.8 billion at a 53% gross margin; full-year 2026 guidance calls for €34–39 billion in revenue (roughly 11.6% growth at the midpoint) with 51–53% gross margin. Backlog stood at €38.8 billion at year-end 2025 after a record €13.2 billion bookings quarter. Market capitalization: approximately €600B / $690 billion.
ASML’s margin is the lowest of the “scarcity” tier in this piece, not because its moat is weaker, but because its business model runs on multi-year order books and long manufacturing lead times rather than the vertiginous spot-market dynamics of GPUs or memory. It is, structurally, the most durable monopoly in the entire chain: there is no second EUV supplier, full stop, and there won’t be one for the foreseeable future given the two-decade, multi-hundred-billion-dollar R&D investment embedded in the current machines. ASML’s growth rate looks modest next to Nvidia’s or Micron’s because it doesn’t need to chase the AI cycle. Every advanced chip on earth, AI or otherwise, already runs through its tools.
Layer 4 — Memory
High-bandwidth memory (HBM), the memory stacked directly onto the GPU package to feed it data at the bandwidth AI training requires, has been the best-performing sub-sector in semiconductors in 2026, and it deserves the most caution of anything in this piece.
SK Hynix dominates the category, with roughly 50–56% global HBM share, reported Q1 2026 revenue of approximately ₩52.6 trillion (~$35.5 billion), up 198% year-over-year, at an operating margin near 72%. Its market cap has roughly doubled over the trailing twelve months to around $586 billion. Micron has ridden the same wave from the number-three HBM position (roughly 20–24% share): fiscal Q3 2026 revenue hit $41.46 billion, up 346% year-over-year, at an 84.9% non-GAAP gross margin, with FQ4 guidance of $50 billion in revenue at roughly 86% gross margin — a business that traded at single-digit multiples on commodity-cycle earnings as recently as 2023 now carries a $1.3 trillion market cap. Samsung holds the remaining roughly 28% and is racing to qualify HBM4 for the next Nvidia platform generation.
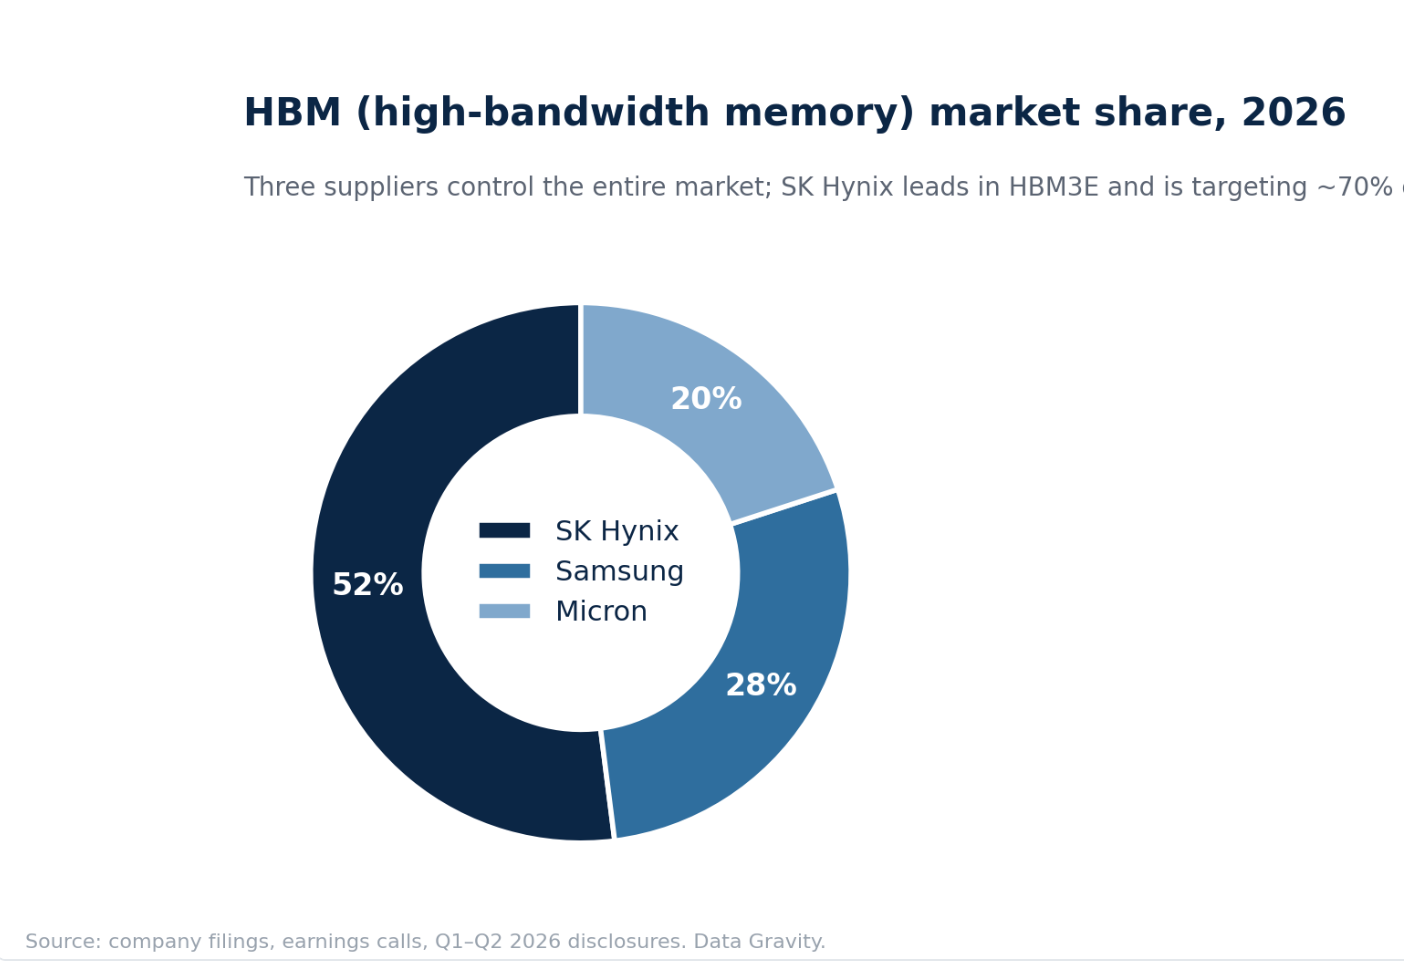
Samsung is the wild card inside this layer, because it’s the only company in the entire stack playing on two boards at once: it holds roughly 28% of HBM share directly behind SK Hynix and Micron, and it’s simultaneously the only credible, if distant, alternative to TSMC in advanced-node logic foundry. That dual exposure makes Samsung the best-positioned incumbent to benefit if either the memory oligopoly holds or TSMC’s packaging bottleneck creates enough overflow demand for a qualified second source, and the most likely company to absorb margin if HBM pricing normalizes before Samsung’s foundry business has scaled enough to offset it. At a $1.34 trillion market cap, Samsung trades as a memory story today; the foundry option value is, for now, priced closer to zero.
The margins here, 70–85% gross, look identical to Nvidia’s on paper. They aren’t the same kind of margin. Nvidia’s margin is protected by a software ecosystem that took fifteen years to build and that customers cannot easily leave. HBM’s margin is protected by a supply shortage: three suppliers, all racing to add capacity, in a category that has been through boom-bust cycles roughly every four years since DRAM existed as a product. Peak-to-trough swings recur on an almost metronomic four-year cadence, with prior cyclical turns clustering around 2010–2014, 2014–2018, and 2018–2022. SK Hynix, Samsung, and Micron are all expanding HBM capacity aggressively in response to today’s pricing, and capacity additions of this kind, in memory, have never once failed to eventually overshoot demand.
What makes the current cycle different is its slope, not its shape. Morgan Stanley Research and TrendForce data show DRAM contract pricing up roughly 820% year-over-year heading into 2026 — a spike that dwarfs any prior peak in at least three previous cycles, and the kind of move that historically has marked a cycle’s most extended phase rather than its middle innings.
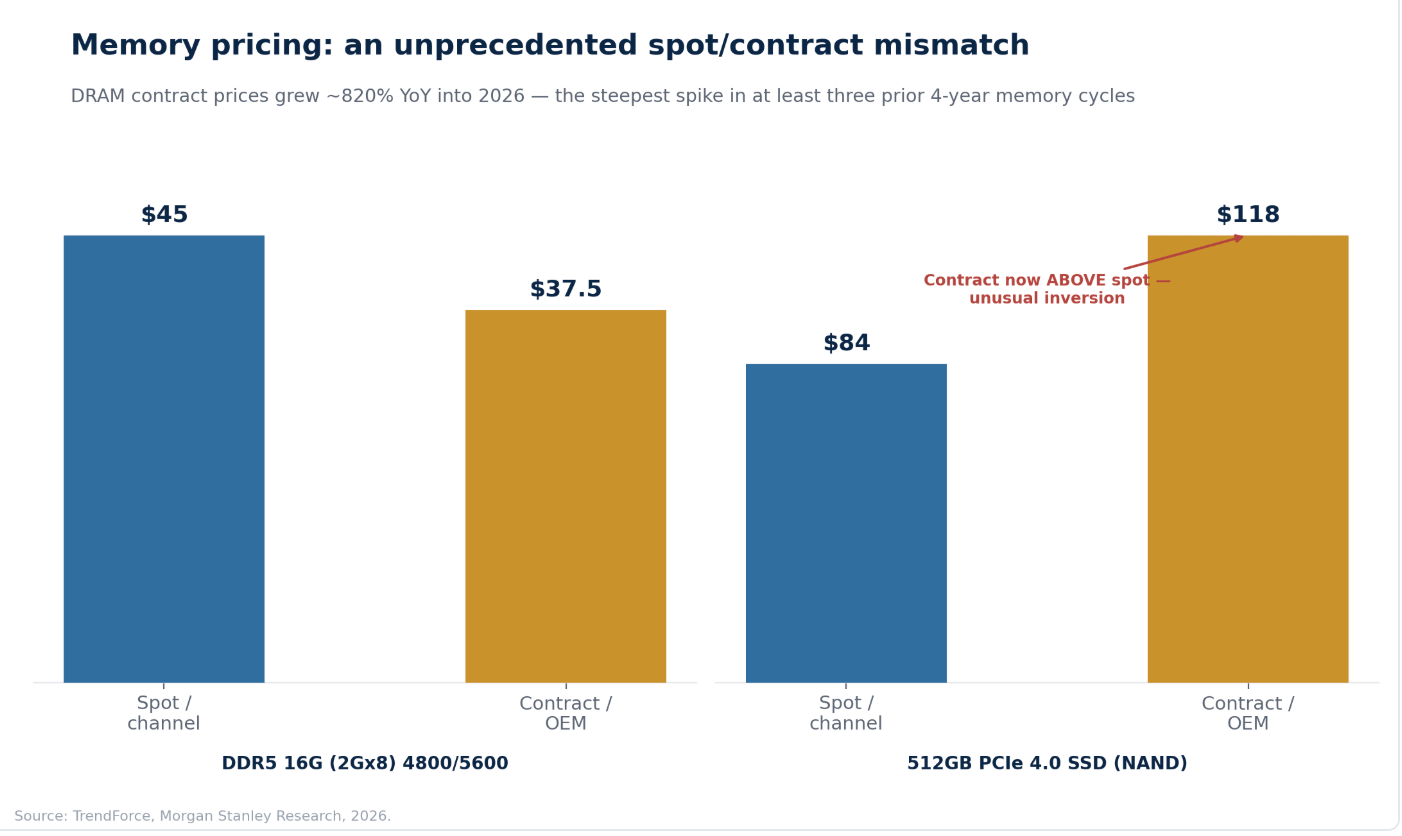
Two additional signals from the same data cut in different directions. First, supply-chain inventory — measured in weeks of stock held across DRAM/NAND suppliers, PC OEMs, module makers, server makers, and smartphone makers — peaked in mid-2024 to early 2025 and has been normalizing through 2026, which removes the destocking buffer that cushioned prior cycles and means fresh demand or supply news now hits pricing more directly. Second, and more tellingly, spot and contract prices have decoupled in opposite directions across the two memory types. DDR5 spot pricing (~$45) currently runs ahead of contract pricing (~$37.50), consistent with a market still tightening in real time, while 512GB NAND/SSD spot pricing (~$84) has fallen below contract pricing (~$118) — an inversion that typically shows up when channel buyers start pulling back faster than the long-lead-time OEM contracts they’re locked into can adjust. That NAND inversion isn’t proof the cycle has turned. It’s the kind of small, early crack in the data that historically precedes one, and it’s the clearest reason the 2028 mean-reversion call earlier in this piece is a base case rather than a low-confidence guess. The 2026 HBM margin structure is real cash flow today and a legitimate multi-year window, but it’s a cyclical profit pool wearing the appearance of a structural one, and it’s the layer in this piece most likely to see today’s 70%+ margins compressed first.
Layer 5 — Networking and Custom Silicon
Broadcom occupies an unusual dual position. Its legacy networking/semiconductor business carries company-wide gross margins around 77% (down slightly from 79.1% a year earlier as mix shifts). Its faster-growing custom AI silicon (XPU) business, designing application-specific accelerators for hyperscalers who want Nvidia-alternative compute, generated $8.4 billion in AI revenue in Q1 FY2026, up 106% year-over-year, against a $73 billion AI backlog and a company target of $100 billion in annual AI semiconductor revenue by 2027. Market capitalization has moved between roughly $1.8 and $2.3 trillion through 2026 depending on the week, among the most volatile large-cap valuations in the stack, reflecting genuine investor uncertainty about how much of Nvidia’s design-layer margin Broadcom’s custom-ASIC model can ultimately capture.
Arista Networks is the purer comparison for the “networking has real pricing power” argument: FY2025 revenue of $9.0 billion (up 28.6%), FY2026 guidance raised to roughly $11.5 billion (27.7% growth), and gross margin held steady at 62–64% even as AI-cluster interconnect demand strains the entire supply chain. Arista’s moat is software-defined switching (EOS) plus deep incumbency in the largest cloud and AI cluster deployments, a smaller-scale, higher-durability cousin of Nvidia’s CUDA lock-in, at a $220 billion market cap.
Custom silicon is the most important competitive threat to Nvidia’s margin structure in the entire stack, and Broadcom is the company best positioned to monetize that threat, which is exactly why its market cap has been so volatile. It’s simultaneously a bet for the Nvidia alternative and against Nvidia’s durability.
That threat is no longer speculative. Custom AI ASIC shipments are projected to grow 44.6% in 2026, nearly three times the 16.1% growth rate projected for merchant GPUs, as Google’s Ironwood TPU, Amazon’s Trainium 3, Microsoft’s Maia 200, and Meta’s MTIA all ship in volume. Amazon has disclosed more than $225 billion in Trainium revenue commitments, and its custom-silicon program reportedly crossed a $20 billion annualized run rate in Q1 2026 (largely internal transfer pricing to AWS rather than external merchant sales, but real capital allocation nonetheless). Broadcom and Marvell together control an estimated 95% of the custom-ASIC co-design market, which means the “threat to Nvidia” and “the next leg of Broadcom’s growth” are, functionally, the same trade.
None of this displaces Nvidia in the near term. CUDA’s ecosystem lock-in means workload migration to custom silicon happens model generation by model generation, not quarter by quarter. But it caps the multiple the market should be willing to assign to the durability of Nvidia’s 75% margin, even as the level of that margin stays intact for the foreseeable future.
Layer 6 — Power and Cooling
Vertiv is the cleanest “picks and shovels” business in the stack: data center power and thermal management, benefiting from the industry’s forced pivot to liquid cooling as rack power densities go vertical. The industry-average rack draws roughly 7.6kW. Nvidia’s GB200 NVL72 draws 120–140kW — 16 to 18 times the legacy average — and the 2026 Vera Rubin generation (VR200 NVL72) is specced at 190–230kW, with the long-context CPX variant near 370kW. The 2027 Rubin Ultra (NVL576) roadmap points to roughly 600kW per rack, which is why Nvidia is simultaneously pushing the industry toward 800-volt DC facility power architecture just to make racks north of 600kW physically feasible. Air cooling can’t dissipate any of this. Liquid cooling isn’t an option at these densities; it’s a requirement, and that requirement is what turns Vertiv’s backlog into multi-year, engineering-locked revenue rather than a commodity hardware order. Q1 2026 revenue was $2.65 billion (up 30.1% year-over-year); full-year guidance was raised to $13.5–14.0 billion; adjusted operating margin expanded 430 basis points to 20.8%; backlog more than doubled to over $15 billion, covering 12–18 months of forward revenue. Market cap: roughly $121 billion.
Vertiv’s margin sits well below the chip layer but meaningfully above the assembly layer, for a specific reason: power and cooling infrastructure is engineered and specified, not commoditized. It requires deep integration with a data center’s electrical and mechanical design, creates real switching costs once installed, and has a backlog structure that gives multi-quarter revenue visibility other layers in the stack lack. It’s a smaller moat than the chip layer, but a durable one — a fact the market underappreciated through 2023–2024 and has since substantially repriced.
Layer 7 — Cloud and Neocloud
Hyperscale cloud and neocloud look like the same business — renting AI compute — and this is where the framework produces its sharpest, most investable distinction: they are not, financially, the same business at all.
AWS posted Q1 2026 segment revenue of $37.6 billion (up 28% year-over-year) and segment operating income of $14.2 billion, a 37.7% operating margin. Microsoft Azure grew 39% year-over-year in constant currency in the same period, with company-wide operating margin at 46.3%, up from 45.7% a year prior, even as Microsoft guided to roughly $190 billion of calendar-2026 capex (up 61% from 2025). Oracle Cloud Infrastructure (OCI) grew 93% to $5.8 billion in its most recent quarter, backed by a staggering $638 billion remaining-performance-obligations backlog (up 363% year-over-year), but Oracle’s implied margin on this business is thin, and the stock gave back roughly a third of its market cap between early June and early July 2026 (from ~$614 billion to ~$450 billion) as investors reassessed how much of that backlog converts to profitable revenue versus GPU-lease pass-through.
CoreWeave, the largest pure-play “neocloud,” tells the cautionary version of this story in numbers: 2026 revenue guidance of $12–13 billion against a $99.4 billion contracted revenue backlog, 2026 capex guidance of $31–35 billion, roughly $25 billion of debt on the balance sheet as of Q1 2026, and an adjusted operating margin of only about 6%. Crusoe, still private, is scaling revenue toward an estimated $2 billion in 2026 and has seen its valuation nearly triple in eight months, from just over $10 billion (October 2025 Series E) to reported talks near $30 billion (July 2026) — a re-rating pace that outstrips even the memory names.
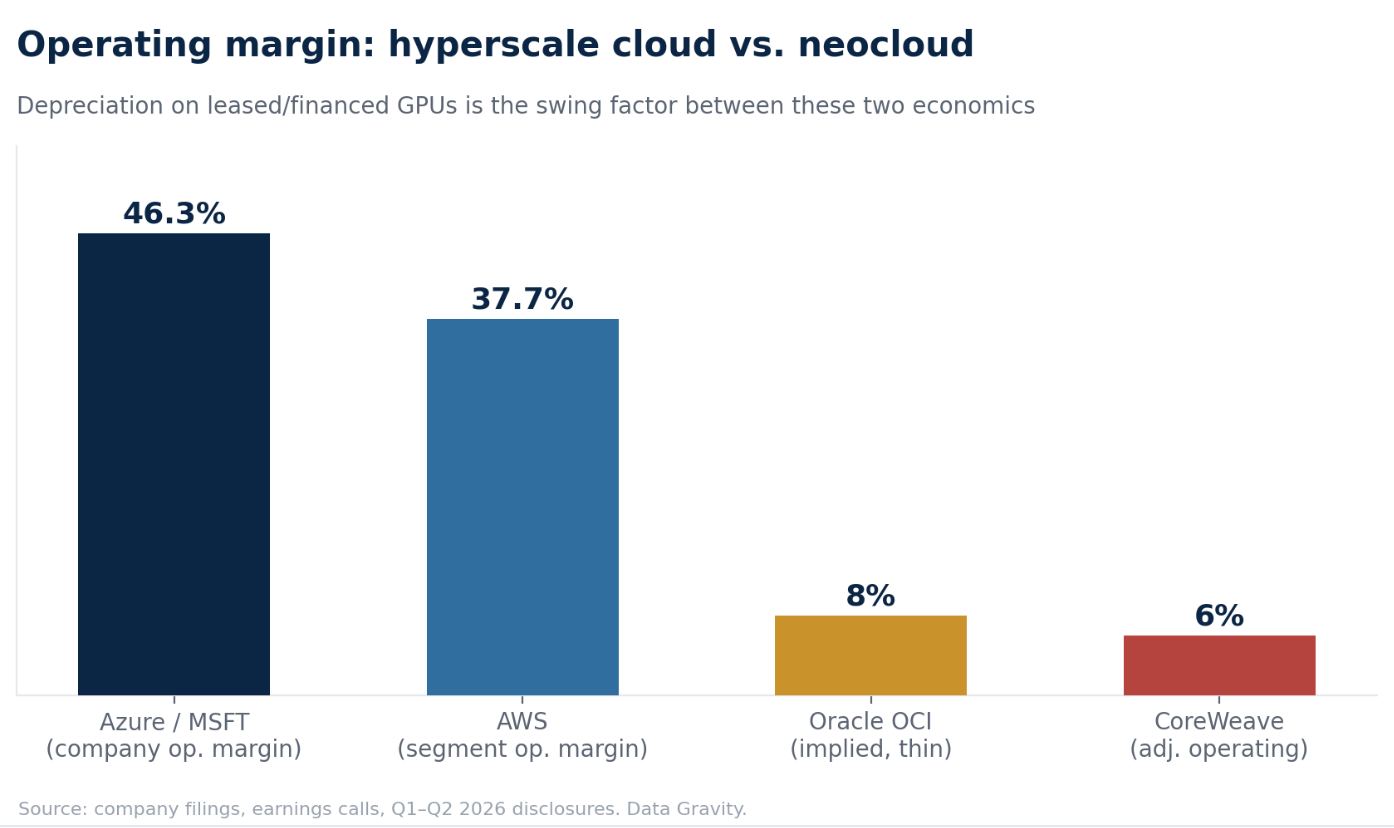
The mechanism behind the margin gap is depreciation and financing structure, not customer demand. Hyperscalers depreciate GPU capex over five-plus years against a diversified, high-margin software/services revenue base and can subsidize AI infrastructure economics with the rest of the business. Neoclouds are frequently financing GPU purchases with debt collateralized by the GPUs themselves, running at far higher balance-sheet leverage, and monetizing a single asset class (raw compute rental) into a market where hyperscalers are simultaneously their landlord, their supplier, and increasingly their competitor.
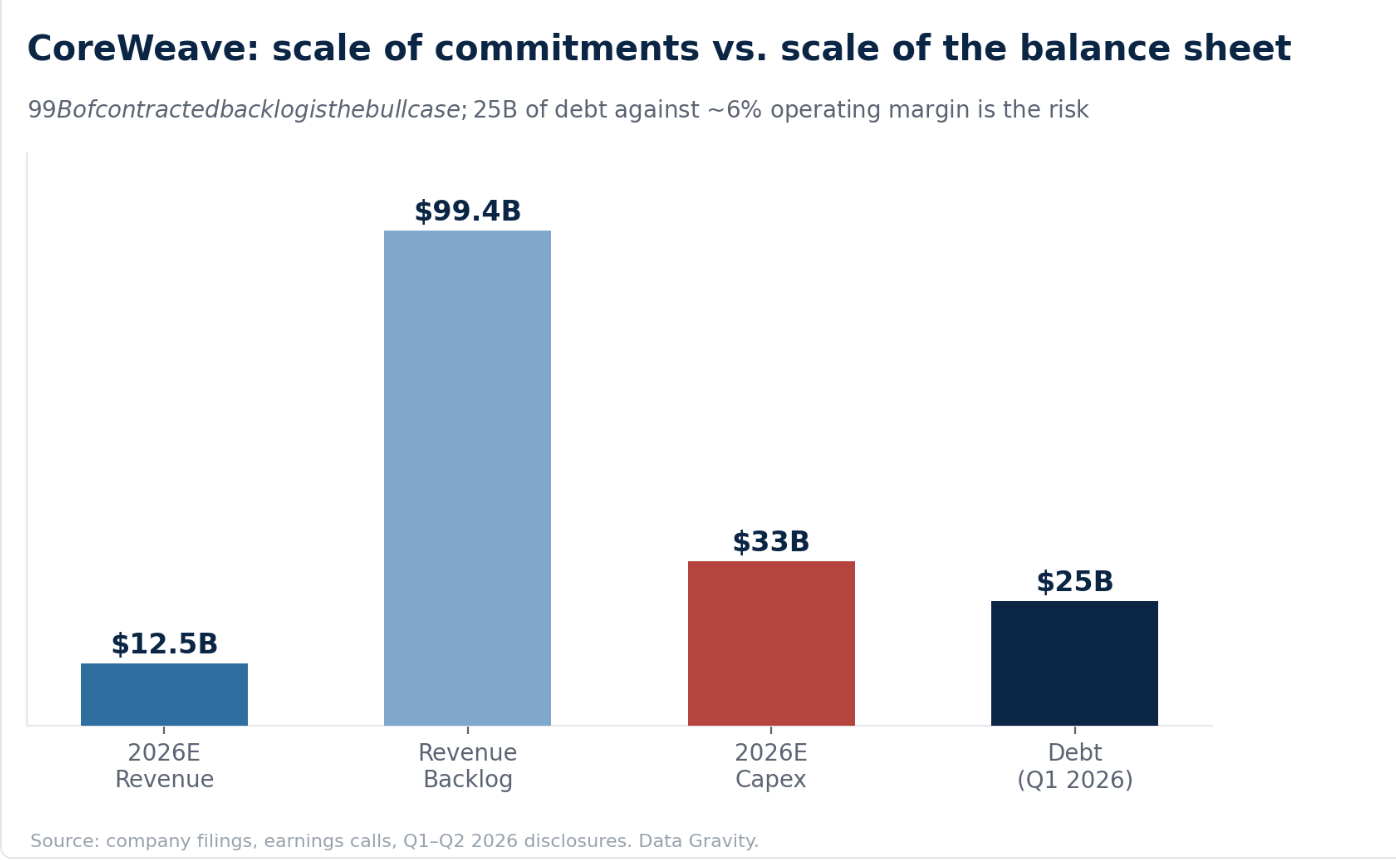
CoreWeave’s $99 billion backlog is the bull case for the neocloud model: real, signed, multi-year demand from credible counterparties, largely Microsoft, OpenAI, and other frontier labs. Its $25 billion of debt against a 6% operating margin is the bear case: neoclouds have taken on hyperscaler-level capital intensity without hyperscaler-level margin protection, and CoreWeave’s market cap has fallen from prior highs to roughly $47–58 billion through June 2026 as the market repriced that mismatch.
Growth Is Universal; Margin Is Not
Isolate growth alone and every layer in this stack looks like a buy. That’s exactly the trap.
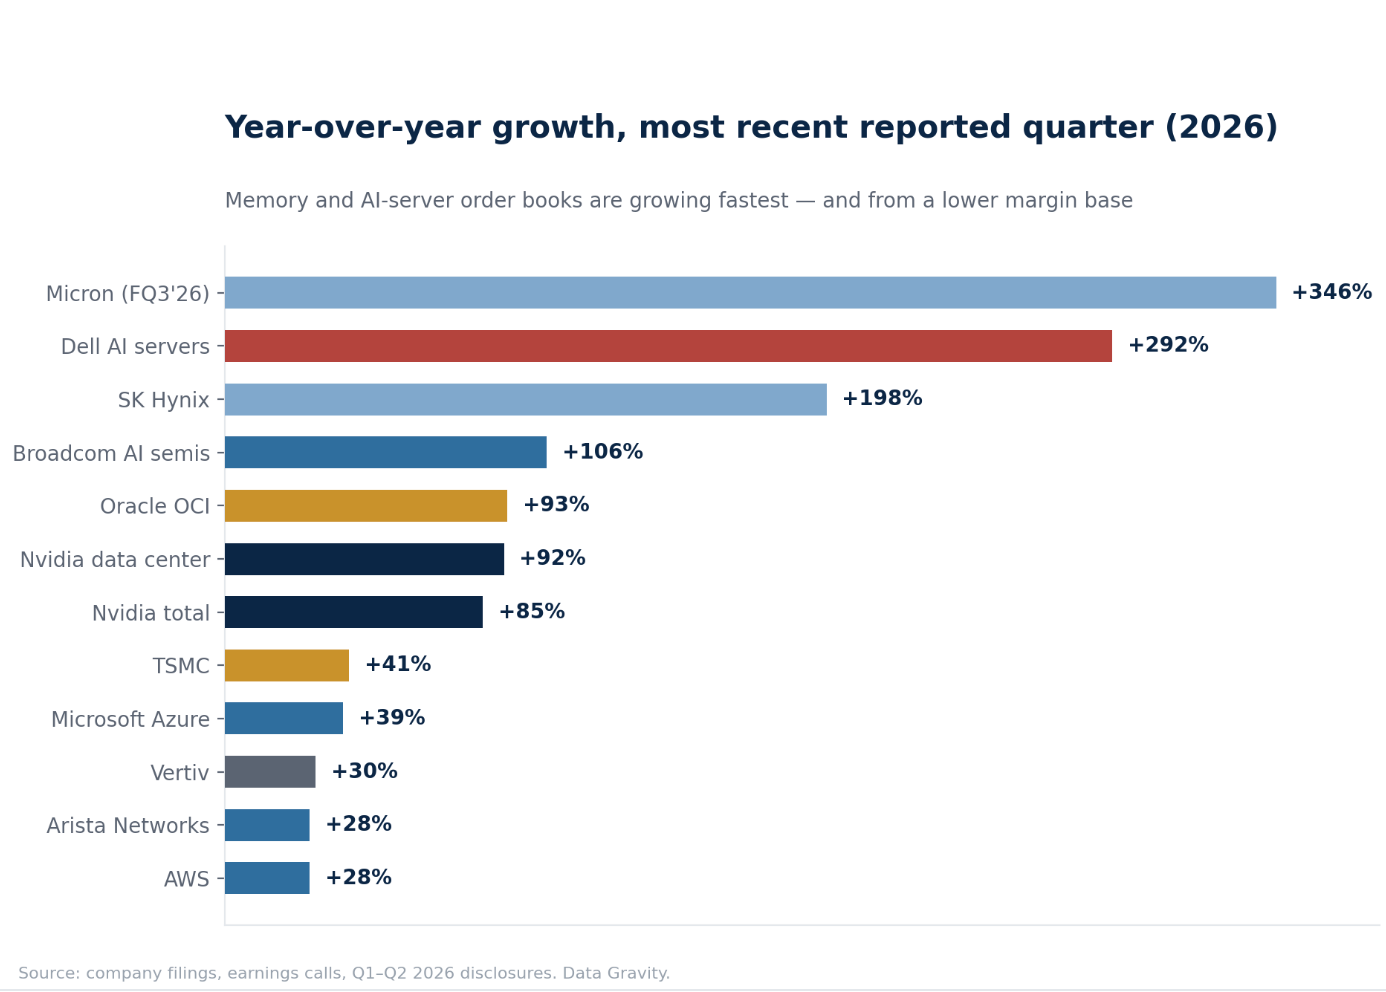
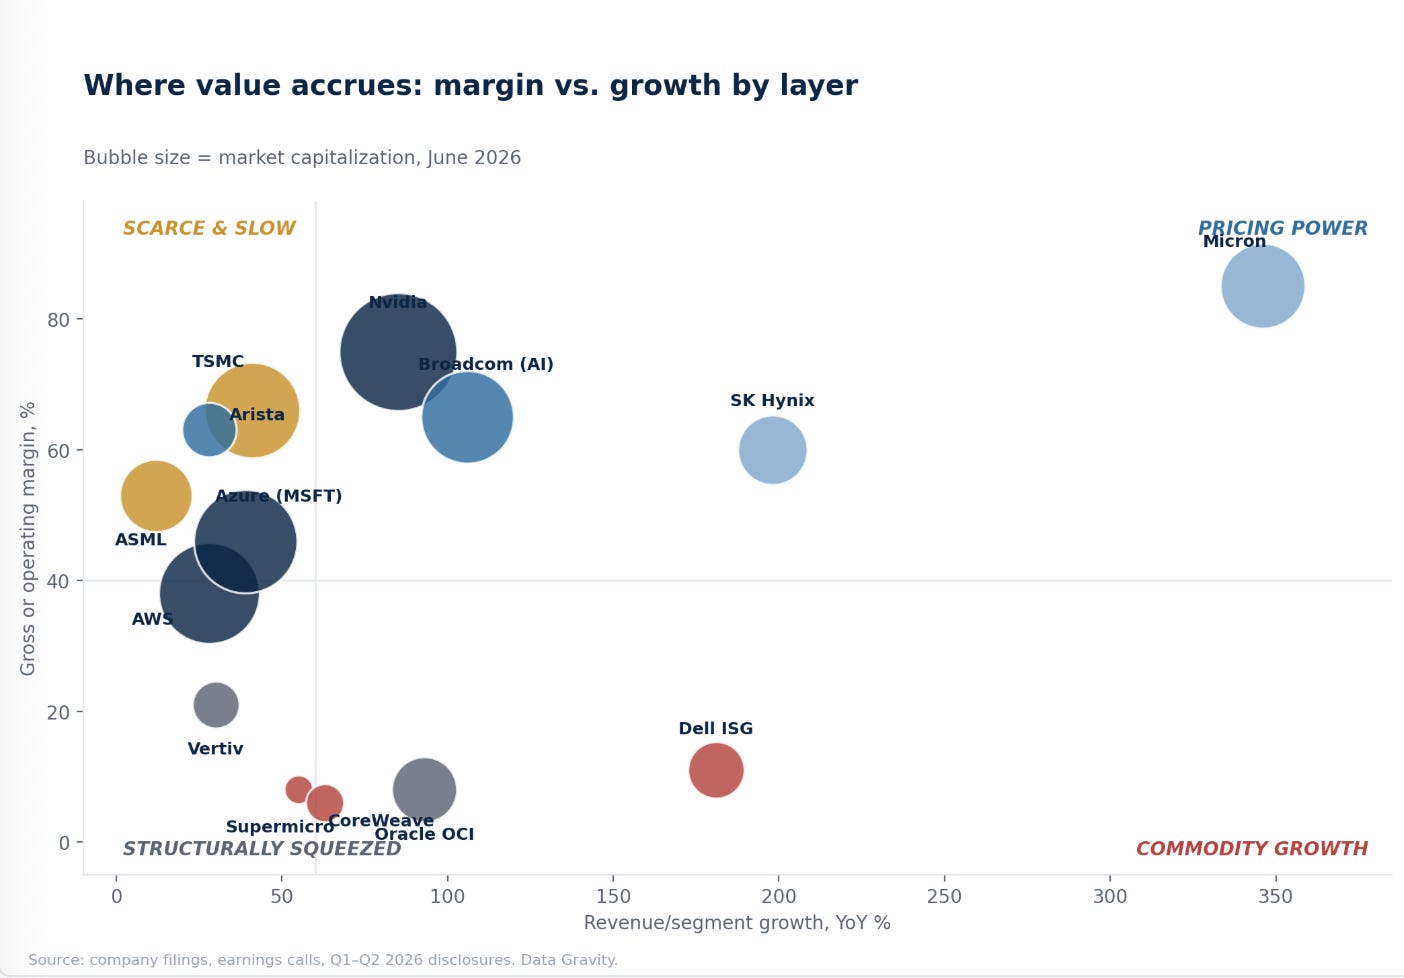
Dell’s AI server business (+292%) and Micron’s memory business (+346%) are growing faster than Nvidia (+85%) or TSMC (+41%). By a naive growth-rate screen, the assembly and memory layers look like better businesses than the design and foundry layers. They aren’t, because growth in this stack is a function of end-market demand, which every layer shares roughly equally, while margin is a function of competitive structure, which varies enormously by layer. A commodity business growing 292% is still a commodity business — it simply commoditizes a larger dollar volume every quarter. It’s the most common mistake in surface-level analysis of the AI infrastructure trade, and it’s why the margin-by-layer view earlier in this piece matters more than any growth chart on its own.
Capital Intensity
The other variable growth-rate screens miss is how each layer’s expansion is financed, and this is where the durable and temporary tiers diverge most sharply in risk, not just in margin.
TSMC and ASML both run enormous capital expenditure programs — TSMC’s annual capex runs in the $40–52 billion range — but they fund it from operating cash flow generated at 50%+ net margins, leaving the balance sheet essentially unlevered relative to earnings power. Hyperscalers are similar in kind if not in scale: Microsoft’s ~$190 billion 2026 capex plan and Amazon’s roughly $200 billion figure are both funded by companies with 37–46% operating margins on existing, diversified, high-margin revenue bases. AI capex is large in absolute terms but small relative to the cash-generating power of the businesses funding it.
CoreWeave is the inverse case, and the clearest illustration of why capital intensity is a risk factor independent of growth or even margin. Against 2026 revenue guidance of $12–13 billion, the company is guiding to $31–35 billion of capex, a ratio north of 250%, financed substantially with debt (roughly $25 billion outstanding as of Q1 2026) collateralized by the GPUs the capex buys. That’s a fundamentally different risk profile than a hyperscaler spending a similar dollar amount out of a profitable core business: CoreWeave’s downside case involves creditors, not just a lower stock multiple, if its $99.4 billion revenue backlog fails to convert to cash flow on schedule. Oracle’s OCI buildout sits somewhere in between: funded by a large, profitable database and applications franchise, but increasingly reliant on customer prepayments to bridge the gap between capex outlay and recognized revenue, a structure that inflated Oracle’s own reported capex by $20–25 billion in FY2026 and that the market punished with a roughly 27% pullback in market cap between early June and early July 2026 alone.
The rule of thumb for allocators: the safest capital intensity in this stack is capital intensity funded by an already-profitable, already-diversified business. The riskiest is capital intensity funded by debt against a single, undifferentiated, cyclically exposed asset class. That’s the CoreWeave and Crusoe model, and it’s why both companies’ market caps and funding structures deserve more scrutiny than their revenue growth rates alone would suggest.
Putting It Together: Margin vs. Growth Across the Whole Stack
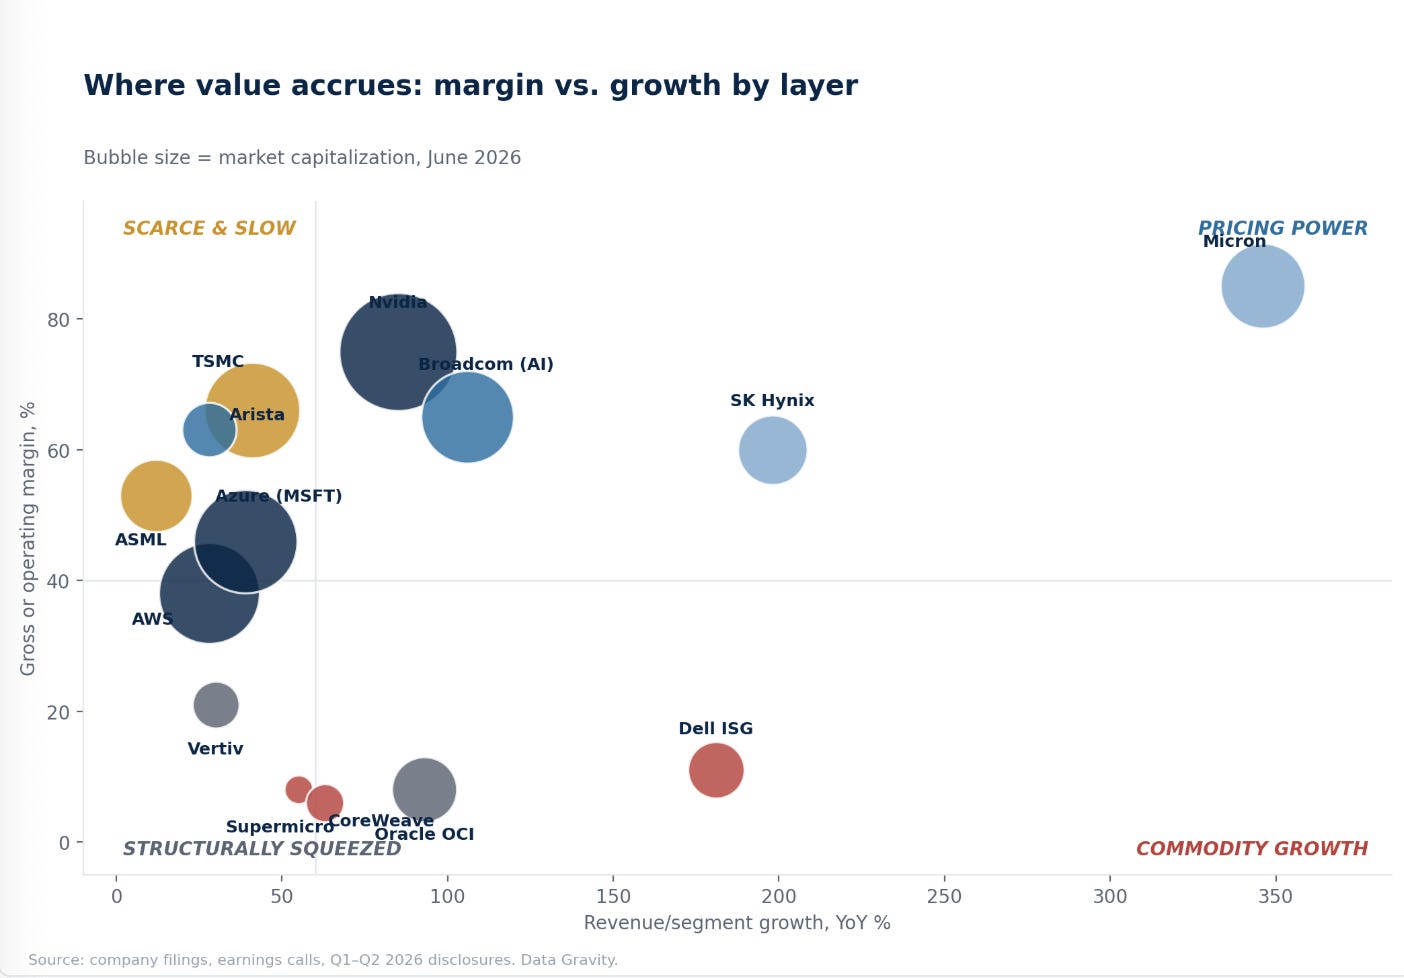
Pricing power (upper right) — Nvidia, Micron, SK Hynix, Broadcom’s AI business. High growth and high margin. The risk here is duration: for the memory names in particular, today’s margin is a function of a supply shortage, not a permanent structural advantage.
Scarce and slow (upper left) — ASML, TSMC, Arista, hyperscale cloud. High margin, comparatively modest growth. These are the most durable profit pools in the stack precisely because they aren’t chasing the AI cycle; AI demand is additive to an already-entrenched, already-profitable core business.
Commodity growth (lower right) — Dell ISG. Enormous volume growth, thin and barely-improving margin. Clear evidence that revenue growth and value capture have become decoupled at the assembly layer.
Structurally squeezed (lower left) — Supermicro, CoreWeave, Oracle OCI (on an implied-margin basis). Real revenue, real demand, and a cost structure (component costs, GPU depreciation, debt service) that consumes nearly all of it.
Where the Money Is Actually Coming From
None of this margin analysis matters without sizing the capital flow behind it. Big Tech capex for AI infrastructure now runs at a scale that exceeds the GDP of most countries.
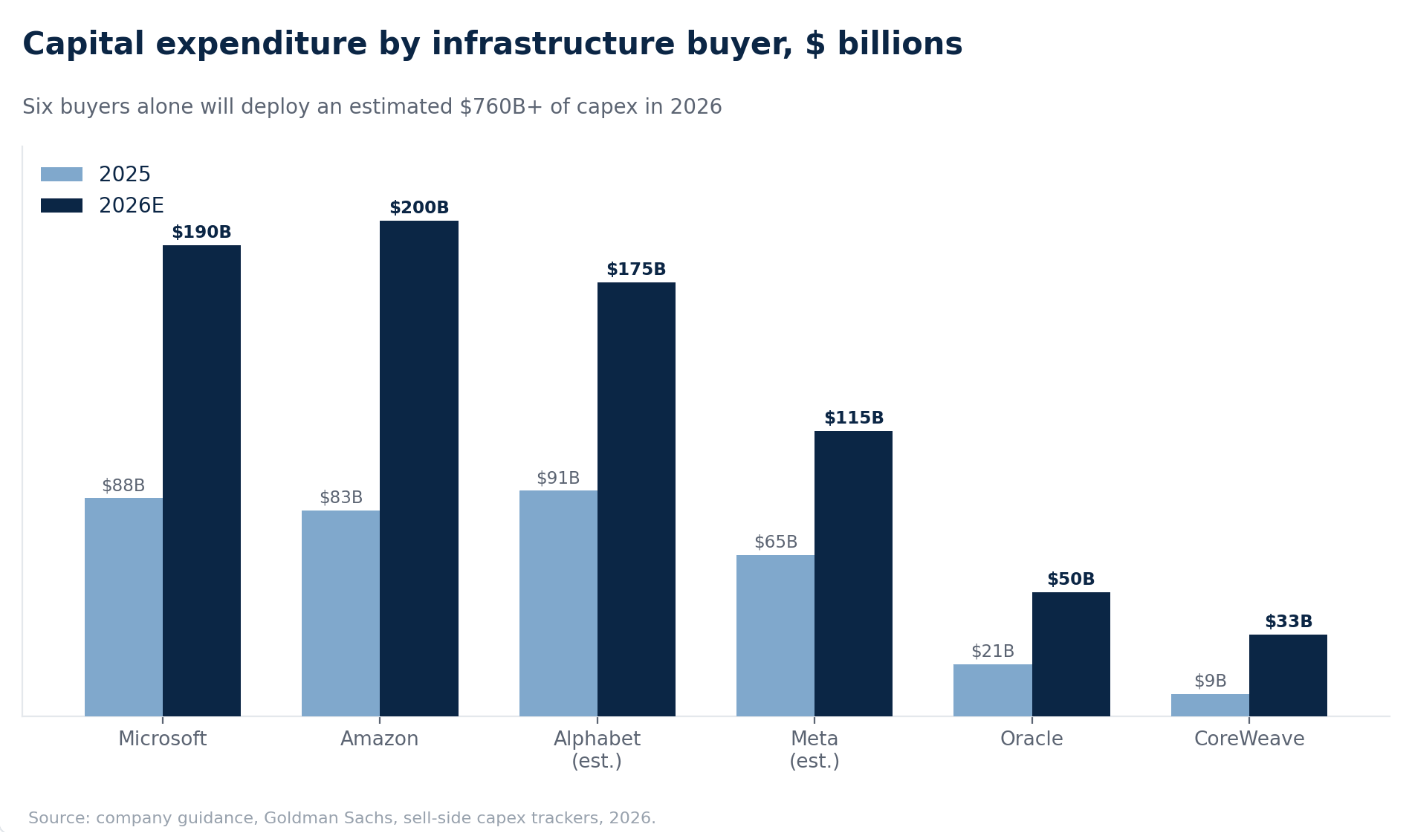
Microsoft, Amazon, Alphabet, and Meta combined are on pace for roughly $725 billion of 2026 capital expenditure, up from about $410 billion in 2025 — a 77% increase in a single year. Layer in Oracle’s roughly $50 billion (a figure that understates cash capex by $20–25 billion once customer GPU prepayments are excluded) and CoreWeave’s $31–35 billion, and six buyers alone deploy over $760 billion into this stack in 2026. Consensus sell-side estimates for total hyperscaler AI capex in 2026 sit at or above $500–527 billion even before neoclouds and sovereign programs (Stargate’s initial $100 billion tranche of a targeted $500 billion by 2029) get added in.
That’s the scale of demand pull that explains why every layer above the assembly tier is capacity-constrained rather than demand-constrained. The binding question for every company in this piece isn’t “will demand arrive” — it already has, several times over, in the form of signed backlog. The binding question is which layers can convert that demand into margin that survives the next capacity cycle.
Where Competition Is Intensifying — and Where It Isn’t
Four fronts to watch, ranked by how much they threaten today’s margin structure:
Custom silicon vs. Nvidia (highest threat to the top of the stack). Google’s TPU program, Amazon’s Trainium, Meta’s MTIA, and the broader Broadcom/Marvell custom-ASIC design business represent the only credible long-term pressure on Nvidia’s 75% gross margin. Broadcom’s $73 billion AI backlog and $100 billion 2027 target are the clearest market signal that hyperscalers are willing to spend real design dollars to reduce Nvidia dependency — not because CUDA can be replicated quickly, but because at hyperscaler volume, even a partial workload shift to purpose-built silicon changes the unit economics enough to justify the multi-year design investment.
Memory capacity response (highest threat to the current HBM supercycle). SK Hynix, Samsung, and Micron are all expanding HBM capacity in direct response to 2025–2026 pricing, and all three have publicly committed to next-generation HBM4 qualification timelines that pull forward the point at which combined supply catches demand. Every previous memory upcycle in the history of the DRAM industry has ended the same way, with the suppliers’ own capacity response overshooting demand and collapsing pricing, typically within 18–30 months of the cycle’s peak signing activity. Nothing suggests this cycle breaks that pattern structurally; there is only evidence that AI training and inference token volumes are growing fast enough to have kept HBM undersupplied for longer than earlier cycles, and that the qualification complexity of HBM4 (versus commodity DDR) may modestly extend the time it takes new capacity to actually count as usable supply. Directionally, though, three well-capitalized competitors racing to add capacity into a 70%+ gross margin is about as reliable a mean-reversion setup as semiconductors produce.
Neocloud commoditization (highest threat to the bottom of the cloud layer). CoreWeave, Crusoe, Lambda, and a growing list of GPU-rental businesses are underwritten by the same asset (Nvidia GPUs) financed against the same buyer pool (frontier AI labs and hyperscaler overflow demand). As hyperscalers build out their own capacity and become less reliant on neocloud overflow, and as more entrants chase the same financing structure, this layer faces the fastest margin compression risk of anything in the stack outside of memory.
Foundry and packaging alternatives (lowest near-term threat, highest long-term uncertainty). Samsung Foundry and Intel Foundry are both investing to close the gap with TSMC on both leading-edge logic and advanced packaging, and both are multiple years and multiple process nodes behind at AI-relevant volume. Geopolitical risk (Taiwan) is the more relevant near-term variable here than competitive risk. CoWoS capacity being “sold out through 2026” is a supply problem TSMC’s competitors would need years to meaningfully address even if they matched the technology today. A Taiwan-related supply disruption wouldn’t shift share to a competitor so much as it would remove 90%+ of the world’s leading-edge AI chip supply from the market simultaneously — a tail risk with no meaningful hedge anywhere else in this stack, and an argument that TSMC’s margin premium is still too low relative to the systemic risk it’s underwriting for the entire industry.
Moat Durability
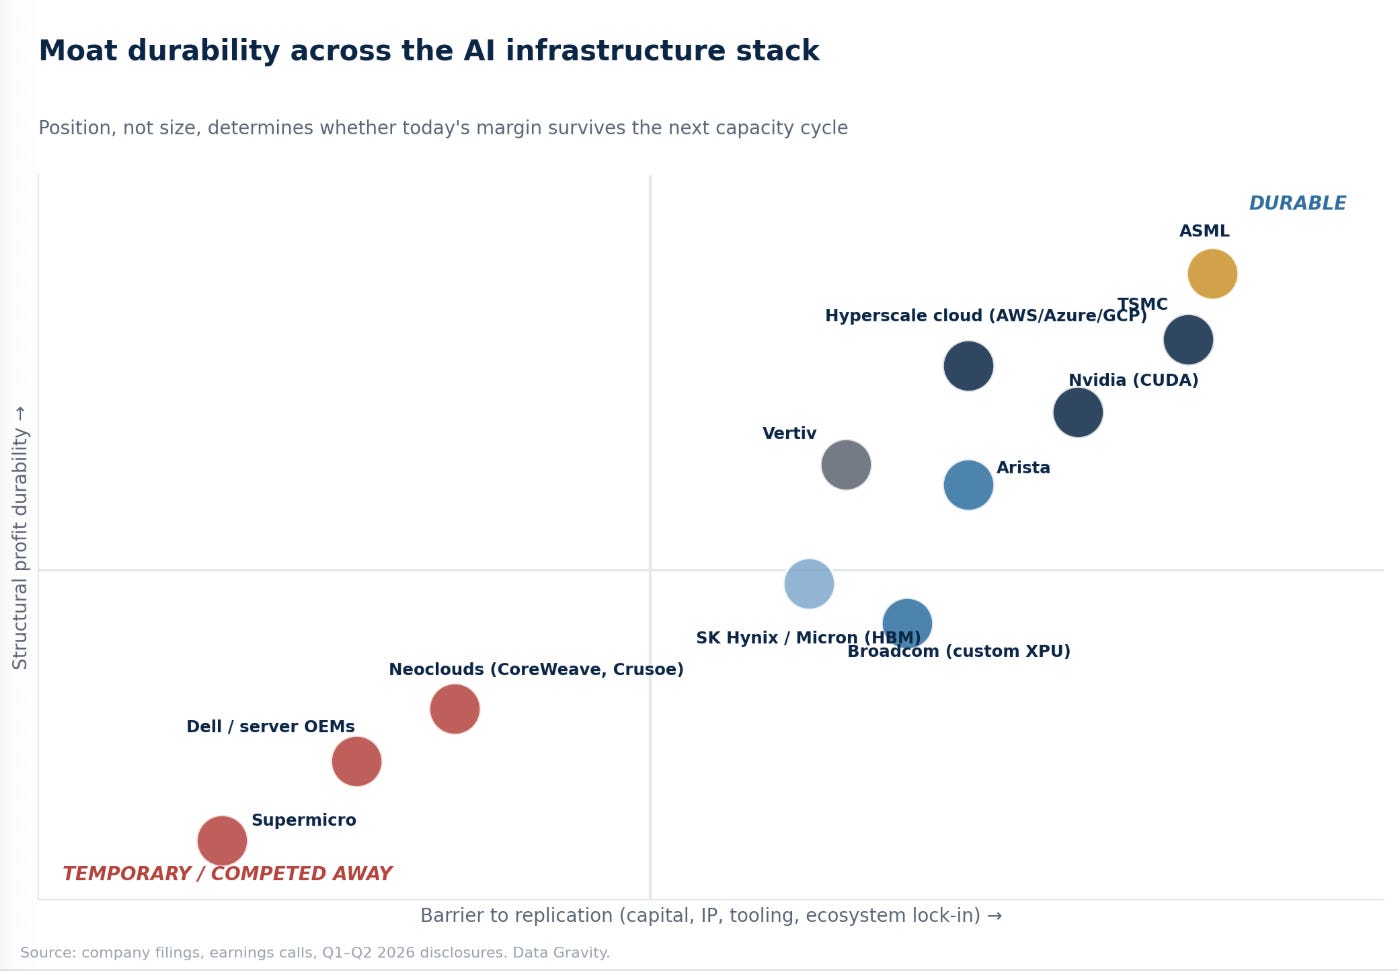
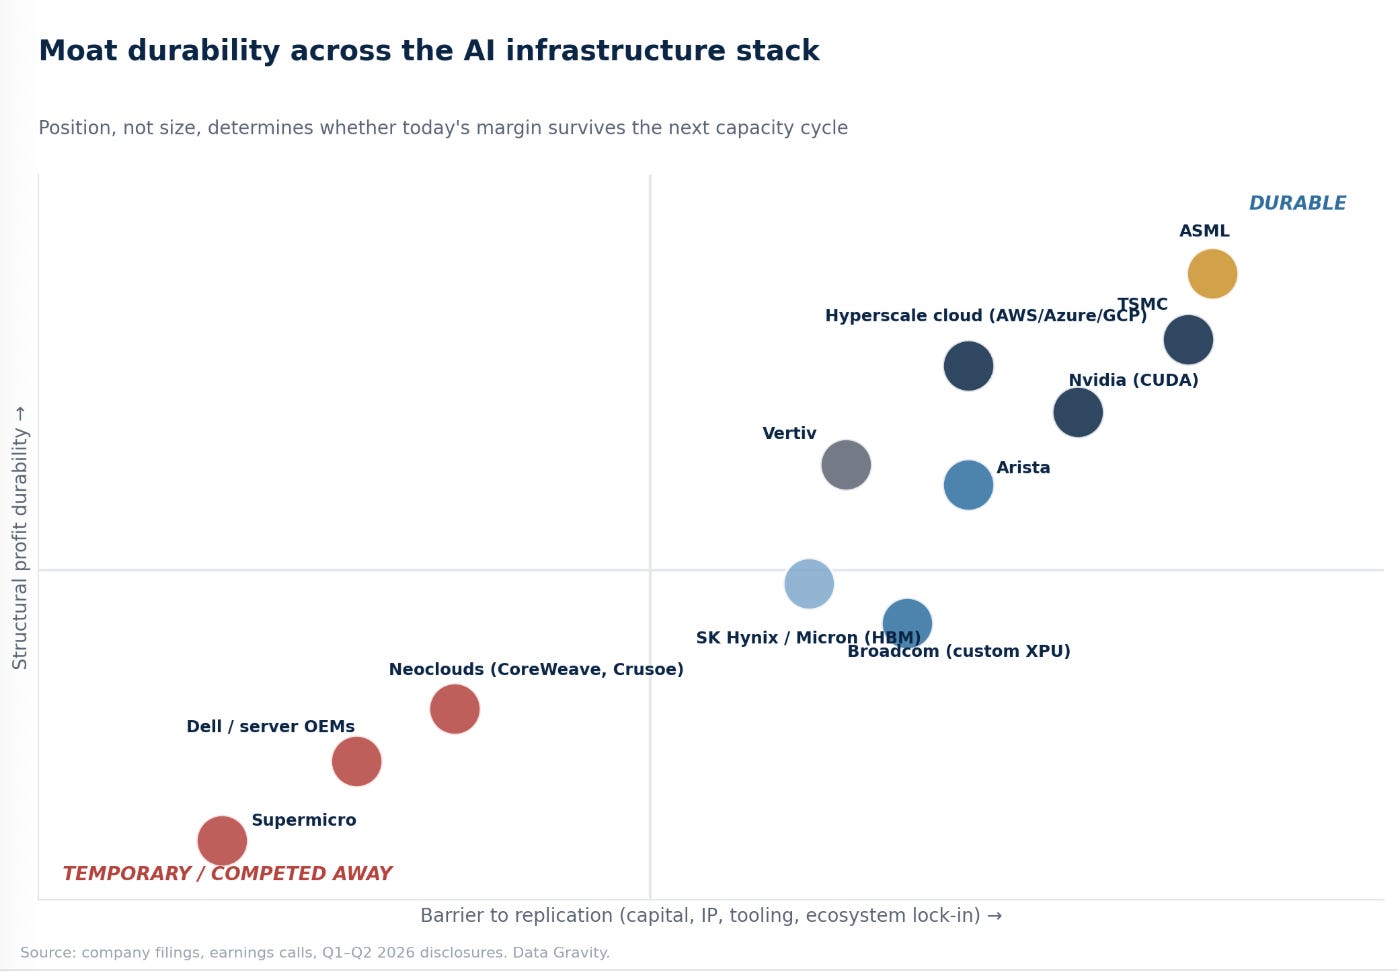
This chart matters more than any other in this piece for allocators, because market capitalization is a poor proxy for moat durability across this stack. Broadcom is larger than Arista by market cap, but Arista’s switching-software moat is arguably more durable than Broadcom’s customer-co-design moat, which depends on hyperscalers continuing to prefer bespoke silicon partnerships over vertical integration. Micron is a larger company than Vertiv, but Vertiv’s engineered, backlog-protected power/cooling business is structurally more durable than Micron’s HBM margin, which is a function of a supply shortage rather than an unassailable technology lead.
The durable tier — ASML, TSMC, Nvidia, hyperscale cloud, Arista, Vertiv — shares a common feature: replicating any of them requires either a monopoly-grade technology position, a decade-plus of accumulated manufacturing yield, an entrenched software ecosystem, or contractually embedded switching costs. The temporary tier — HBM suppliers, Broadcom’s custom-ASIC business, and especially Dell/Supermicro and the neoclouds — shares the opposite feature: their current margin is a function of a supply/demand imbalance (memory, GPUs) or a temporary strategic preference (custom co-design), not a barrier competitors cannot eventually cross.
“Durable” doesn’t mean these companies’ growth rates stay elevated forever. ASML’s ~12% growth this year already shows that durable-moat businesses can grow slower than the cycle’s hottest names while still compounding capital more reliably. It means the rate of return on the next incremental dollar of capacity stays high, because a competitor can’t show up in eighteen months and bid it away. That distinction, durability of returns versus rate of growth, is the one growth-rate-only screens systematically miss. It’s also why this framework treats Broadcom’s custom-silicon business (real growth, contested durability) so differently from Arista’s switching business (slower growth, largely uncontested durability), despite both sitting in the same “networking-adjacent” bucket on a superficial market map.
Implications
For venture and growth investors: the layers worth funding are the ones where a new entrant can either attack an incumbent’s replicability weakness (better financing structures or differentiated workload specialization for neoclouds, alternative packaging/interconnect approaches that ease the CoWoS bottleneck, novel cooling architectures that outpace Vertiv’s engineering lead), or become the next layer’s version of CUDA: a software or orchestration moat that makes switching costly regardless of whether the underlying hardware is commoditized. Capital deployed into “another GPU cloud” or “another server integrator” without either of those two attributes goes into the least defensible part of the entire value chain, regardless of how fast the segment’s revenue is growing.
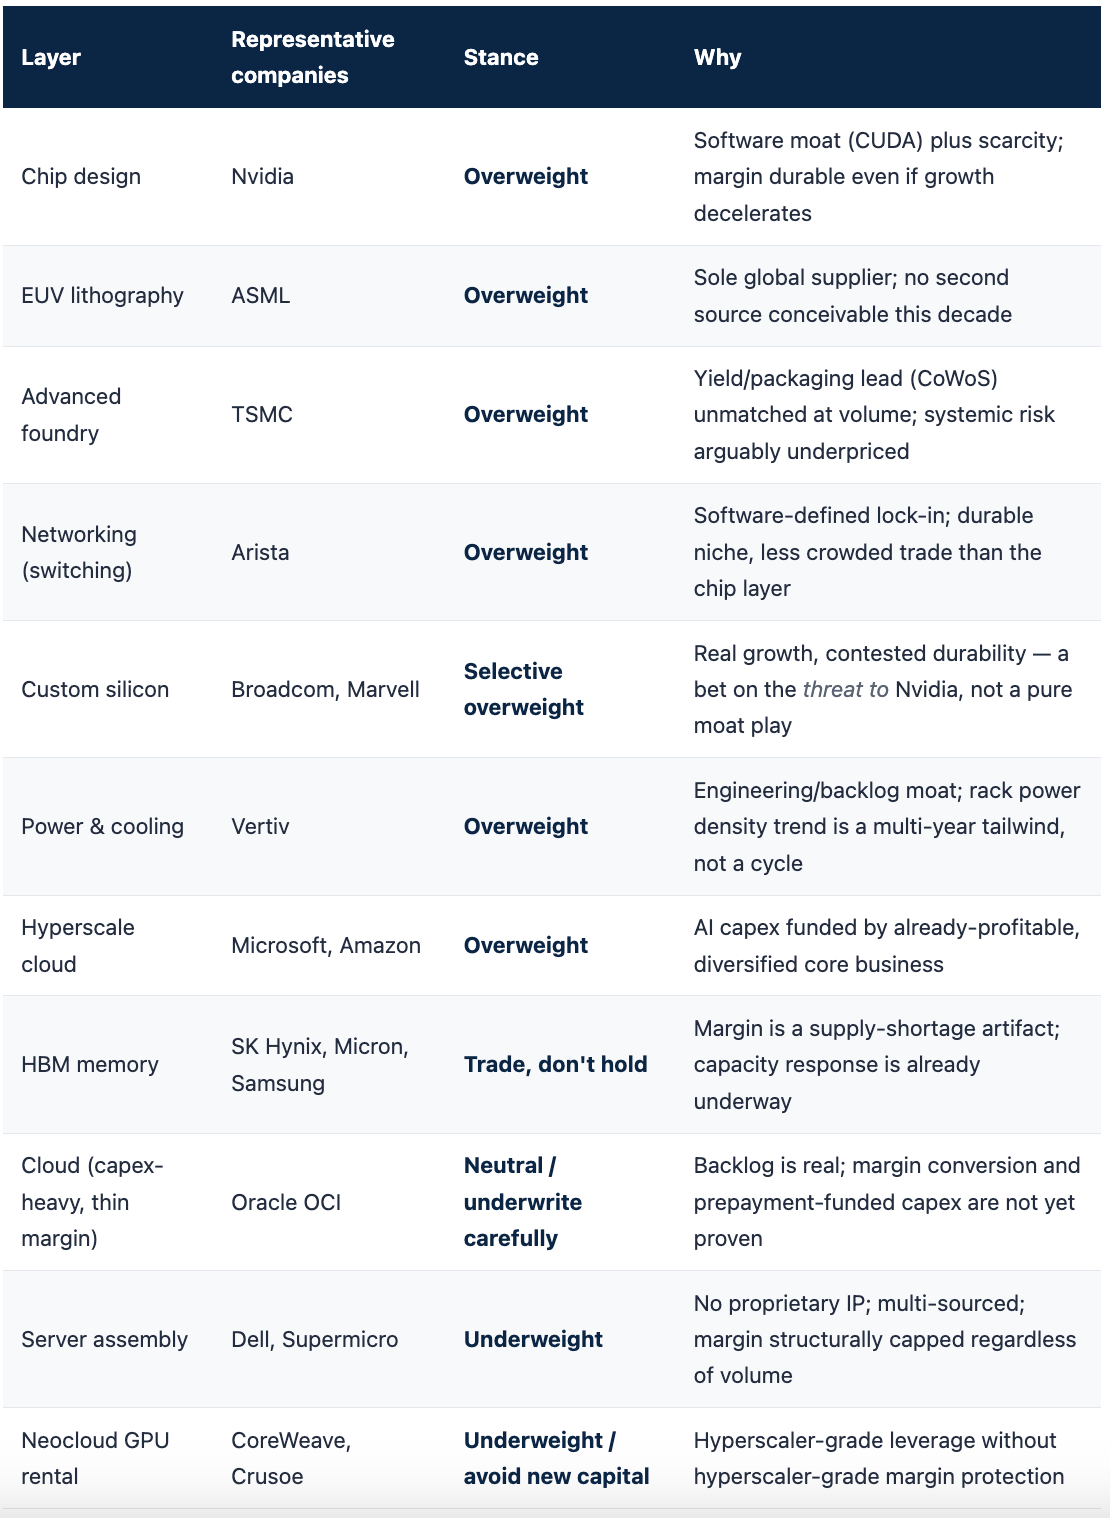
For public-market allocators: the framework argues for structural overweight to the durable-moat tier (ASML, TSMC, Nvidia, Arista, hyperscale cloud parents) funded by structural underweight to the commodity-assembly and neocloud tier (server OEMs, pure-play GPU rental), with HBM memory treated as a high-conviction trade, not a long-term holding. The margin is real and probably persists through 2027, but memory cycles do not skip a beat forever, and 70–85% gross margins on DRAM-derived products have never once proven permanent.
For corporate strategists inside hyperscalers and enterprises: the custom-silicon investment thesis is validated by Broadcom’s backlog growth, but the CUDA software moat means the payback period on internal silicon programs is measured in years of workload migration, not quarters, and the capex commitment (Big Four at $725 billion in 2026) suggests the industry is underwriting Nvidia’s near-term pricing power even while actively trying to escape it. Enterprises buying AI infrastructure directly rather than through a hyperscaler should weight the capital-intensity framework above as heavily as the headline price-per-GPU-hour: a neocloud offering below-market pricing today is very often financing that discount with leverage that carries more risk than it appears to, and a vendor’s balance sheet is now a legitimate infrastructure-procurement diligence item in a way it simply wasn’t three years ago.
On timeline: the durable-tier thesis (Nvidia, TSMC, ASML) is a multi-year holding period call with limited need for precise entry timing, given the underlying scarcity is structural rather than cyclical. The HBM memory trade has a shorter effective horizon, probably 12 to 24 months of further upside before capacity additions from all three suppliers begin to bite, based on the historical cadence of prior memory cycles. The neocloud and assembly-layer caution flagged throughout this piece is closer to an immediate positioning call than a multi-year thesis: the capital-structure risk in that tier is already visible in 2026 pricing (CoreWeave and Supermicro’s compressed market caps relative to revenue growth are the market’s own early verdict), not a risk that requires a future catalyst to materialize.
Summary
Value in the AI infrastructure stack accrues to scarcity, not spend. Nvidia, TSMC, and ASML sit at genuine chokepoints — design IP with a software moat, manufacturing yield with no substitute at volume, and a lithography monopoly with no second supplier — and they price accordingly, at 53–75% gross margins that have held up across multiple demand shocks. HBM memory suppliers currently sit alongside them on margin (70%+ gross) but not on durability: their profit pool is a supply-shortage artifact that history says will eventually mean-revert. Networking (Arista) and power/cooling (Vertiv) occupy a smaller but genuinely durable middle tier, protected by software lock-in and engineering/backlog moats respectively. Server assembly (Dell, Supermicro) and neocloud GPU rental (CoreWeave, Crusoe) sit at the bottom of the stack by design: undifferentiated, multi-sourced, and priced down to single-digit or low-teens margins regardless of how fast their revenue grows, with the neocloud cohort carrying the extra risk of hyperscaler-grade leverage without hyperscaler-grade margin protection.
The $760 billion-plus flowing through this system in 2026 will keep growing. Who keeps it won’t change nearly as much as the market map suggests, and the parts of the map most likely to change are exactly the parts, like HBM memory and neocloud rental, that look most attractive on a trailing-twelve-month growth chart today.
On Memory. I too agree that this is a cyclical phenomenon albeit super-cyclical. The current demand for HBM has no prior analog. It's as if a multi-trillion market was created out of nowhere because the hypercalers have converted their savings into CapEx. In and of itself this action should give us all some pause. Given the long lead times on building new capacity, the multiyear agreements signed by Micron that lock in pricing and estimates that there will be no relief till at least 2028. do you sense that the typical 4-year cycle is shorter than we should expect and this sell-off is a bit premature?
Good analysis and worth a read and re-read. The HBM cycle I am questioning a bit given the reported HBM is sold out already for 2027 and that the industry is moving towards long term agreements. The cyclical dynamics in memory may be less pronounced going forward if LTA are the future of the industry which Micron has also announced in their earnings call. Disclosure I am long SK Hynix and NVIDIA.