


In brief:
Constant-capability inference deflates roughly 10x per year: GPT-3-class went from $60 to $0.06 per million tokens in three years. GPT-4-class is down about 300x.
The discount never applies to the frontier. Flagship pricing fell from $30 to $1.25, then rose back to about $5 with GPT-5.5. Enterprises buy the frontier anyway: open-source share of workloads fell despite far lower prices (Menlo Ventures).
Paid demand out-multiplied the cuts. OpenAI went from $3.7B in 2024 to a reported $40B+ run rate; Anthropic from $1B to $65B in 19 months, with inference margin rising from about 38% to about 70% in a year (SemiAnalysis).
Applications are the fastest revenue cohort in software history (Cursor: $100M to $3B in 17 months) at negative reported gross margins. Outcome pricing and model routing decide who keeps the windfall.
Hyperscalers hold $1.7T of contracted backlog and just posted their first negative free-cash-flow quarters. The open question underneath: who owns GPU depreciation when cost per token falls 10x per generation.
Nvidia manufactures the deflation and disclosed $1T+ of orders for it at a 74.9% gross margin. Power repriced the other way: PJM capacity went from $28.92 to $333.44 per MW-day in four auctions.
Verdict: value migrates toward what cannot be deflated. Frontier capability and distribution at the top, watts and land at the bottom. The undifferentiated version of any business makes less.
This has happened before. Transistors, bandwidth, and electricity all deflated this fast, total spending never shrank, and who kept the money differed each time.
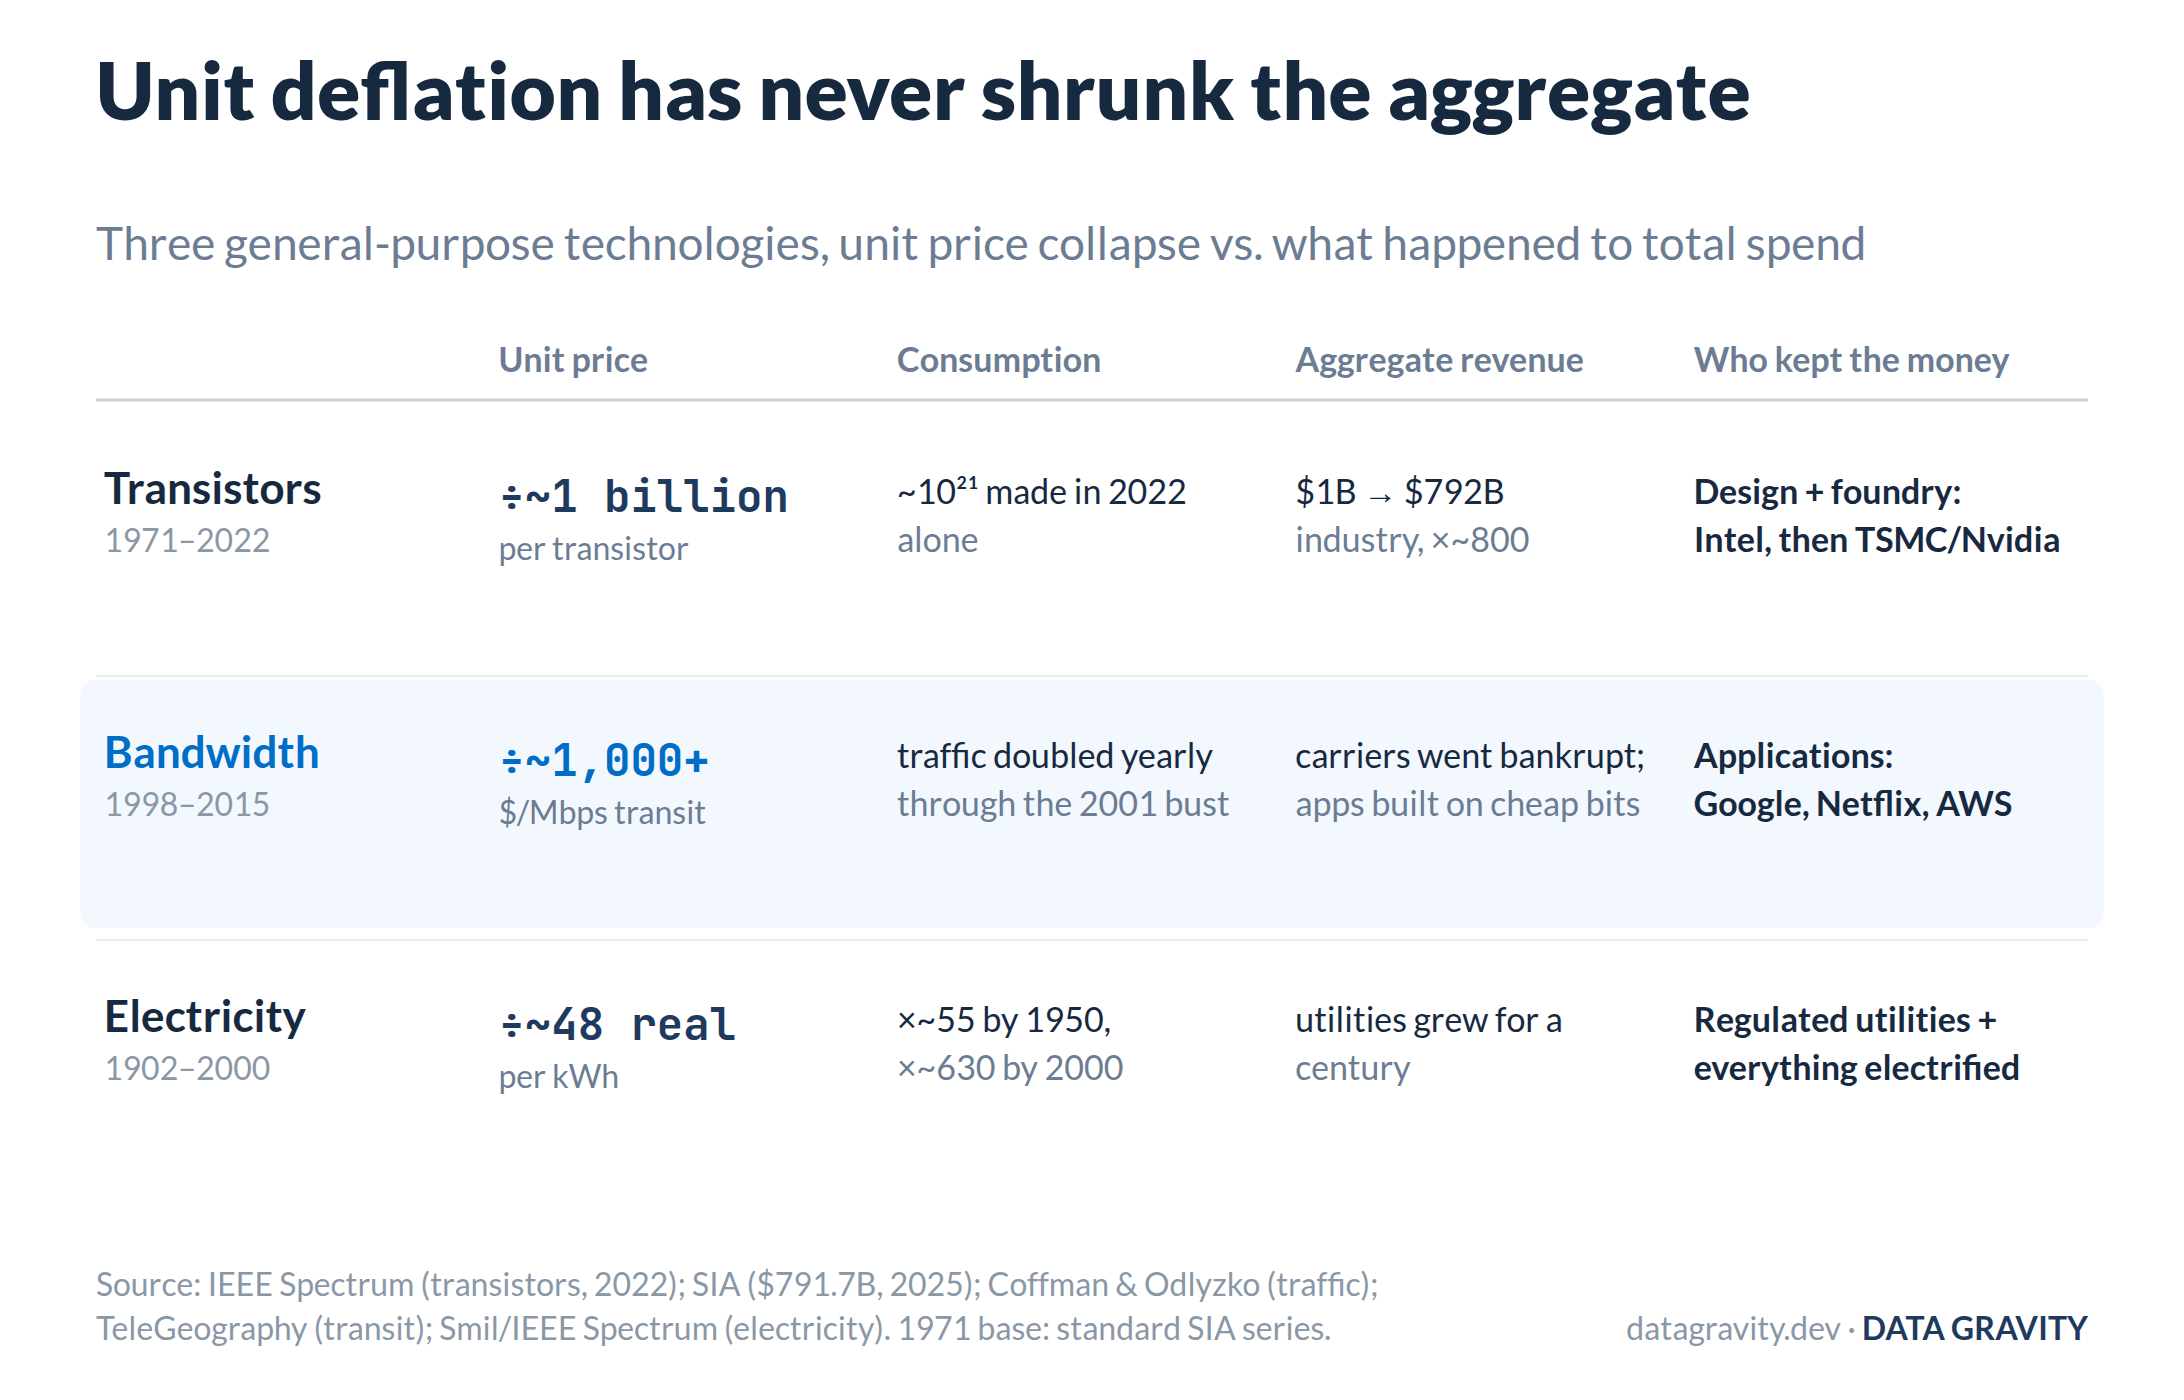
Run the same sorting on today's stack, and this is the answer the rest of the piece defends.
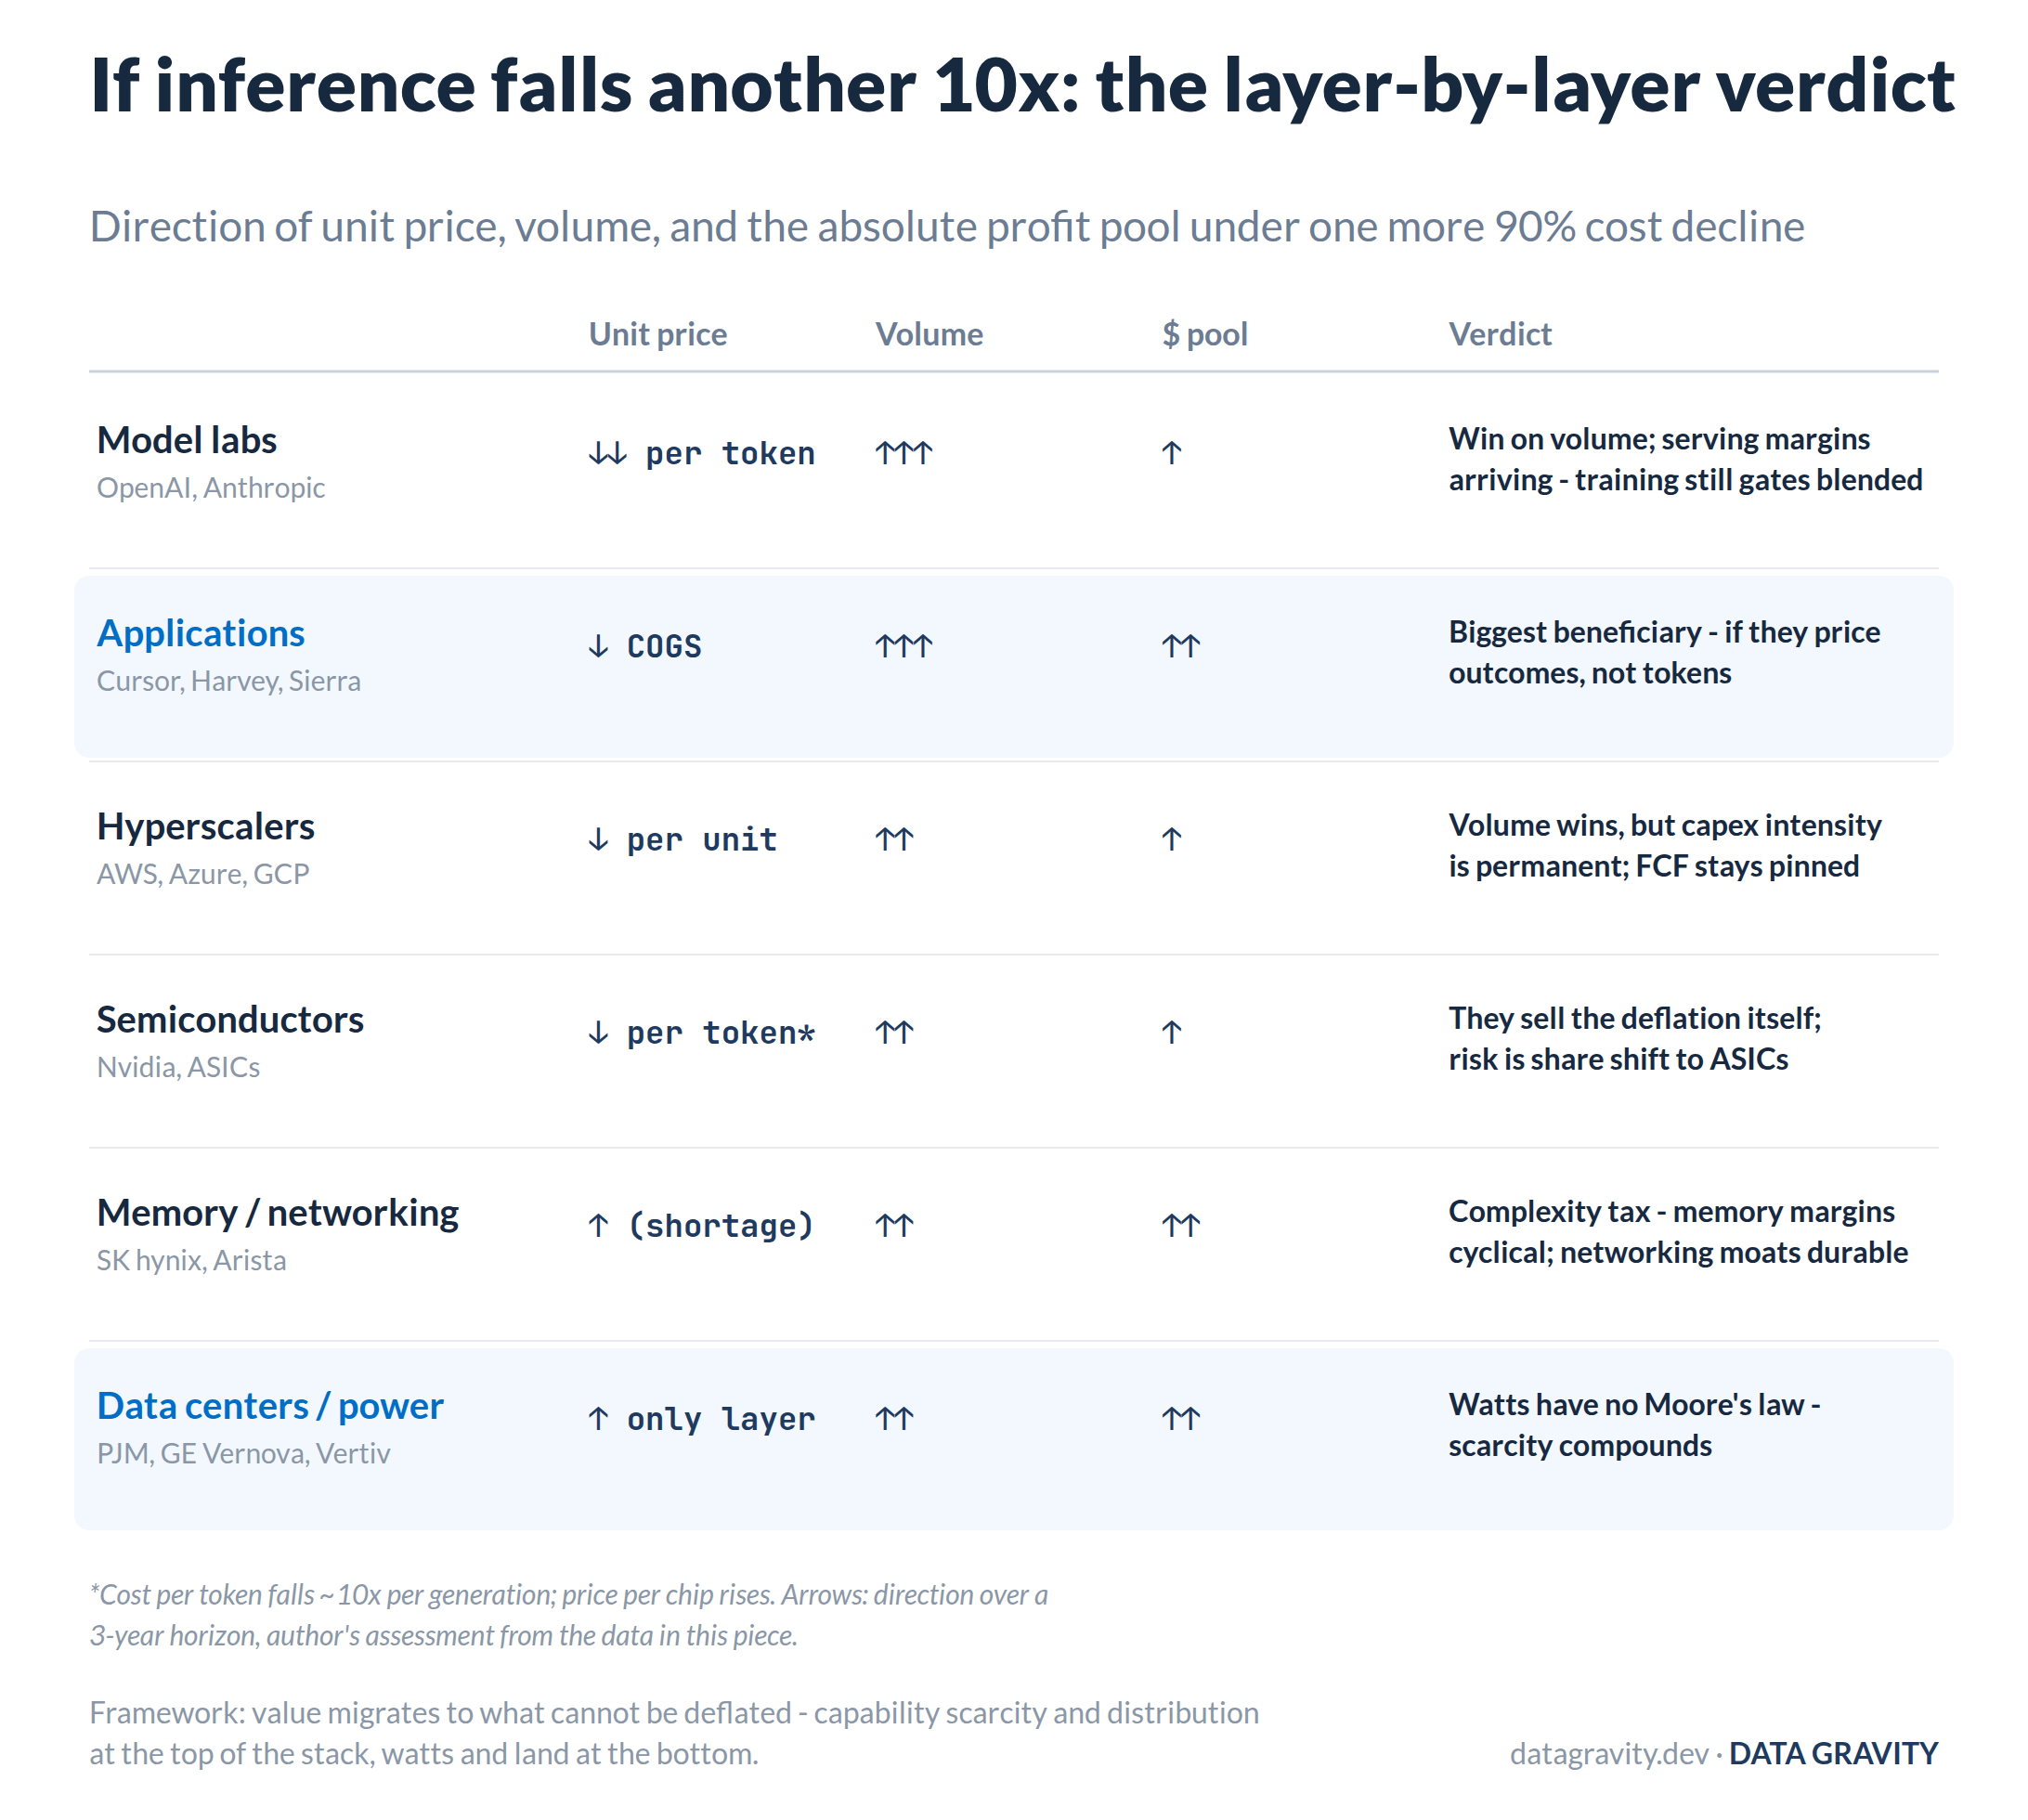
Direction of unit price, volume, and absolute profit pool by layer under one more 90% cost decline. Author’s assessment from the data below.
Thesis
Thesis. The price of a fixed unit of intelligence has fallen roughly 10x per year for four consecutive years. GPT-3-class output cost $60 per million tokens in November 2021 and $0.06 by late 2024, the 1,000x decline a16z documented as “LLMflation.” Every layer underneath that collapse posted record revenue in 2026 anyway.
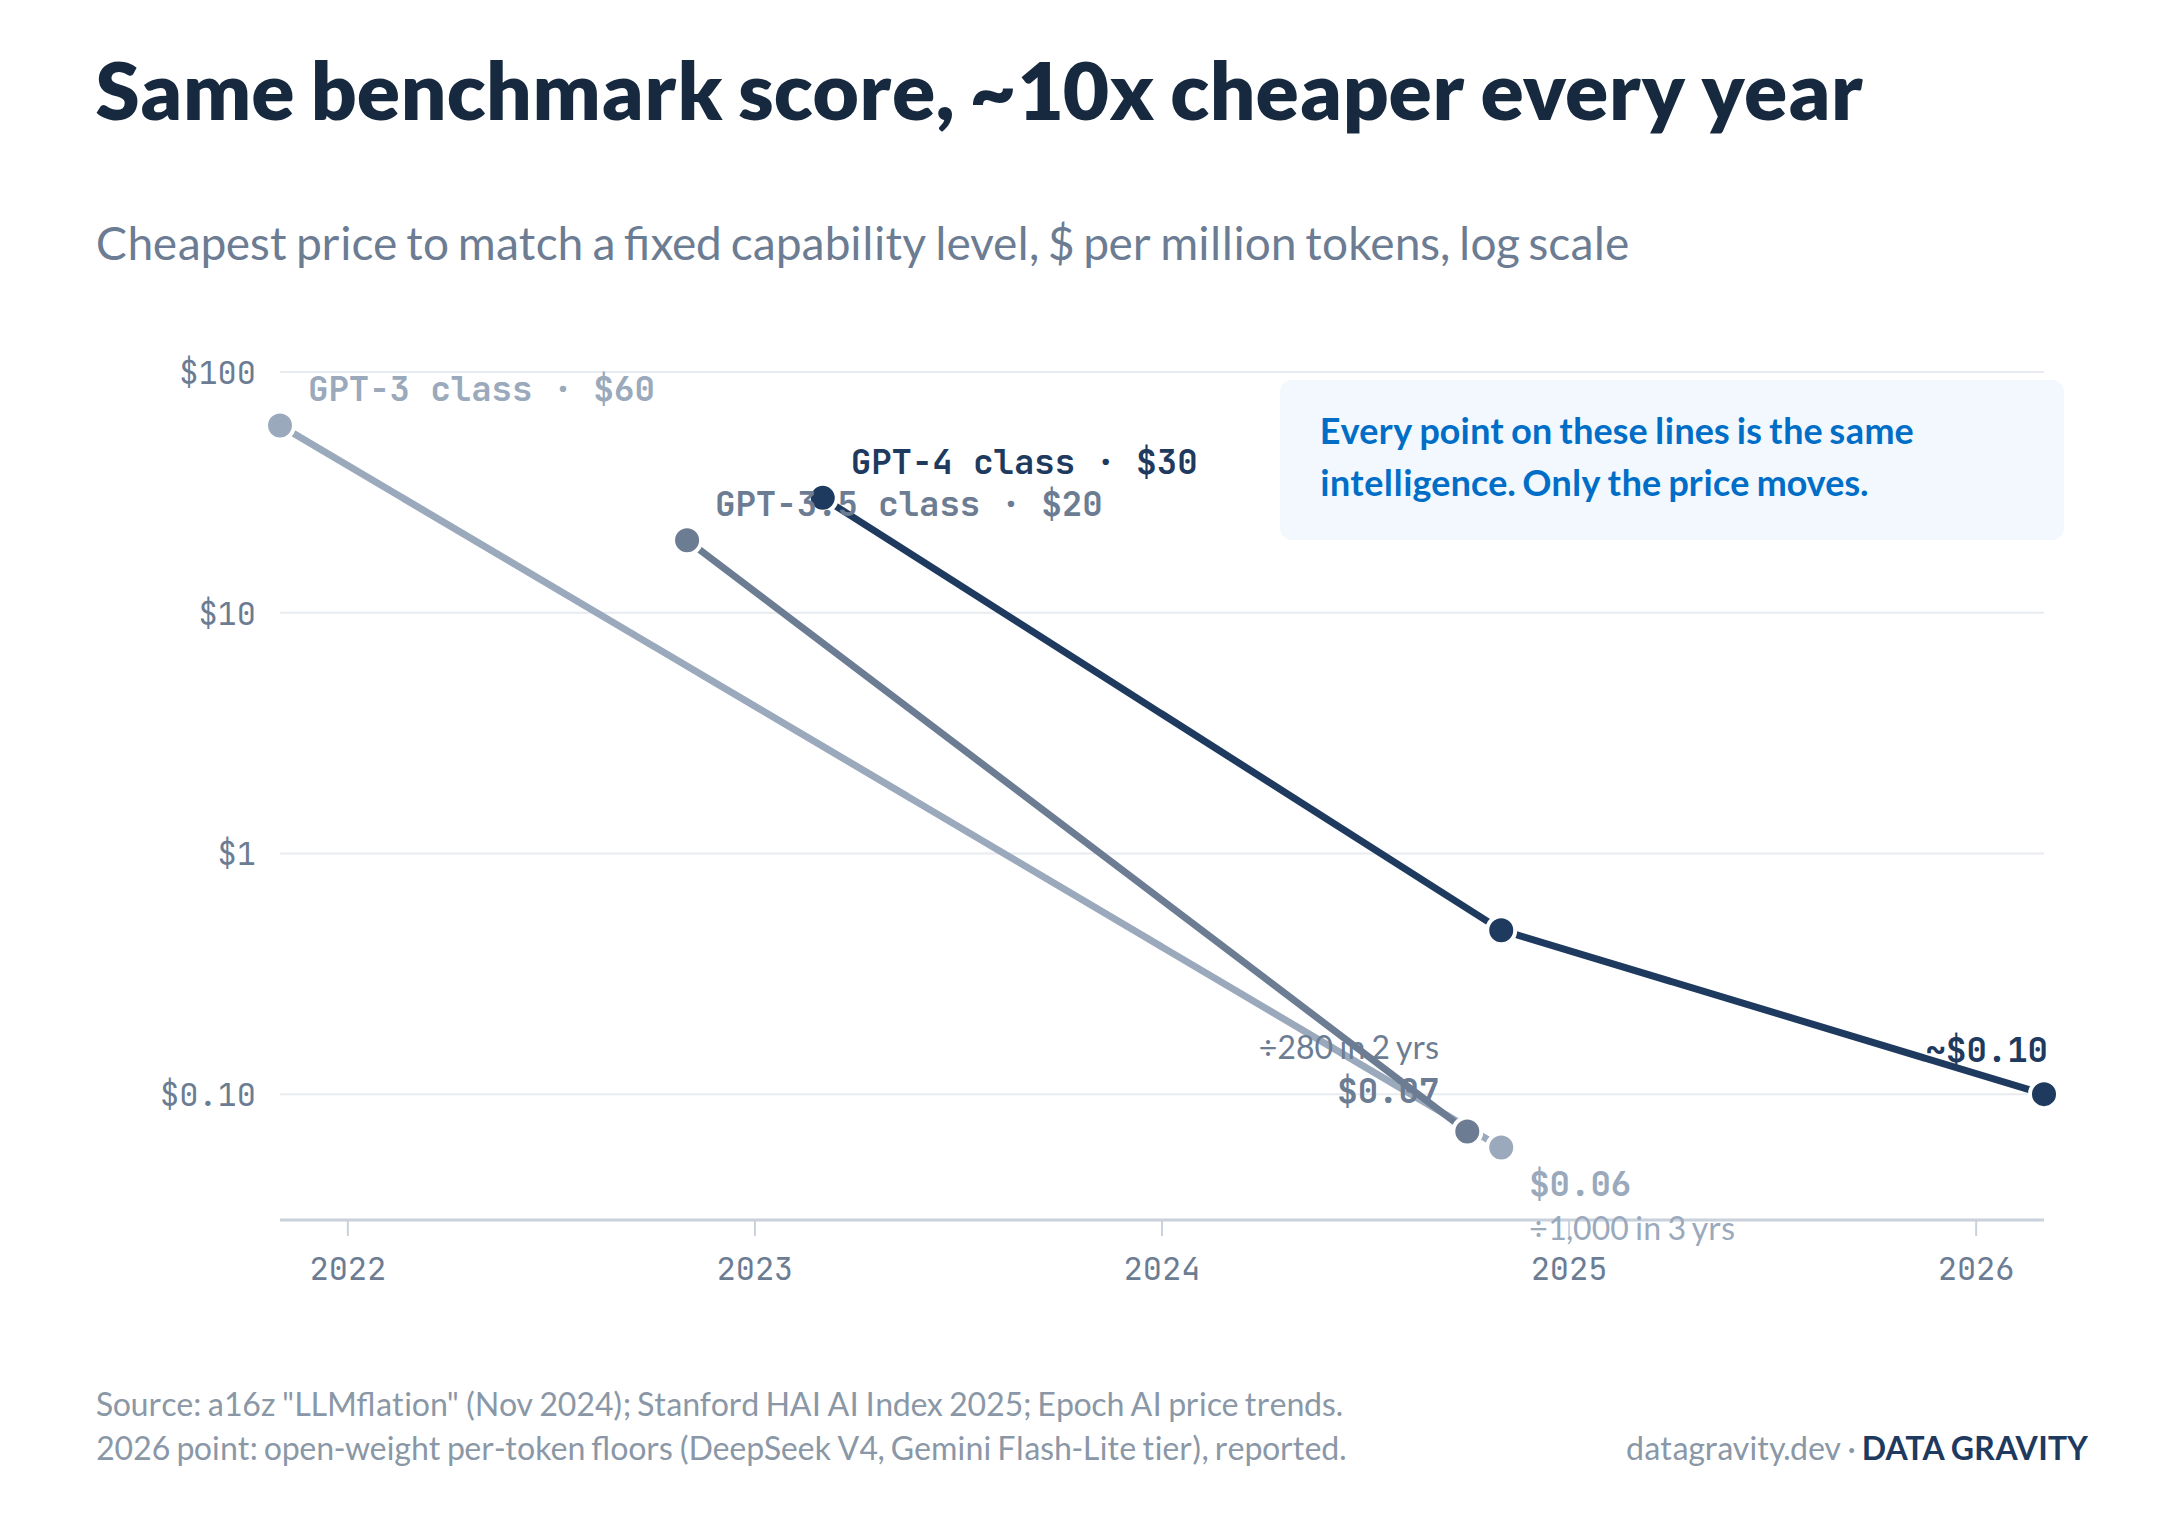
The cheapest price to match a fixed benchmark score (a16z, Stanford HAI, Epoch AI). GPT-3-class fell from $60 to $0.06 per million tokens in three years; GPT-4-class is down ~300x since March 2023.
The August 2026 scoreboard: Nvidia has disclosed over $1 trillion of Blackwell and Rubin order visibility. SK hynix printed a 76% operating margin. Big Four capex is guided near $740 billion, up from $410 billion in 2025. Two labs whose prices fell all year run at a combined ~$90 billion of annualized revenue. And the next 90% decline is already scheduled: Rubin ships this half claiming another 10x cut in cost per token.
So the question is not whether inference gets 10x cheaper. It is which layers convert the deflation into profit, which absorb it as margin compression, and whether value migrates up the stack as infrastructure commoditizes, or whether consumption grows so fast that infrastructure captures enormous absolute dollars anyway.
The last piece in this series argued that value capture in AI infrastructure tracks scarcity, not spend. This one runs that framework through a moving target, and the short answer is that deflation does not move value up or down the stack so much as toward whatever cannot be deflated. At the top, that is frontier capability and distribution. At the bottom, watts. The chart below is the whole piece in one picture. The rest is the evidence.
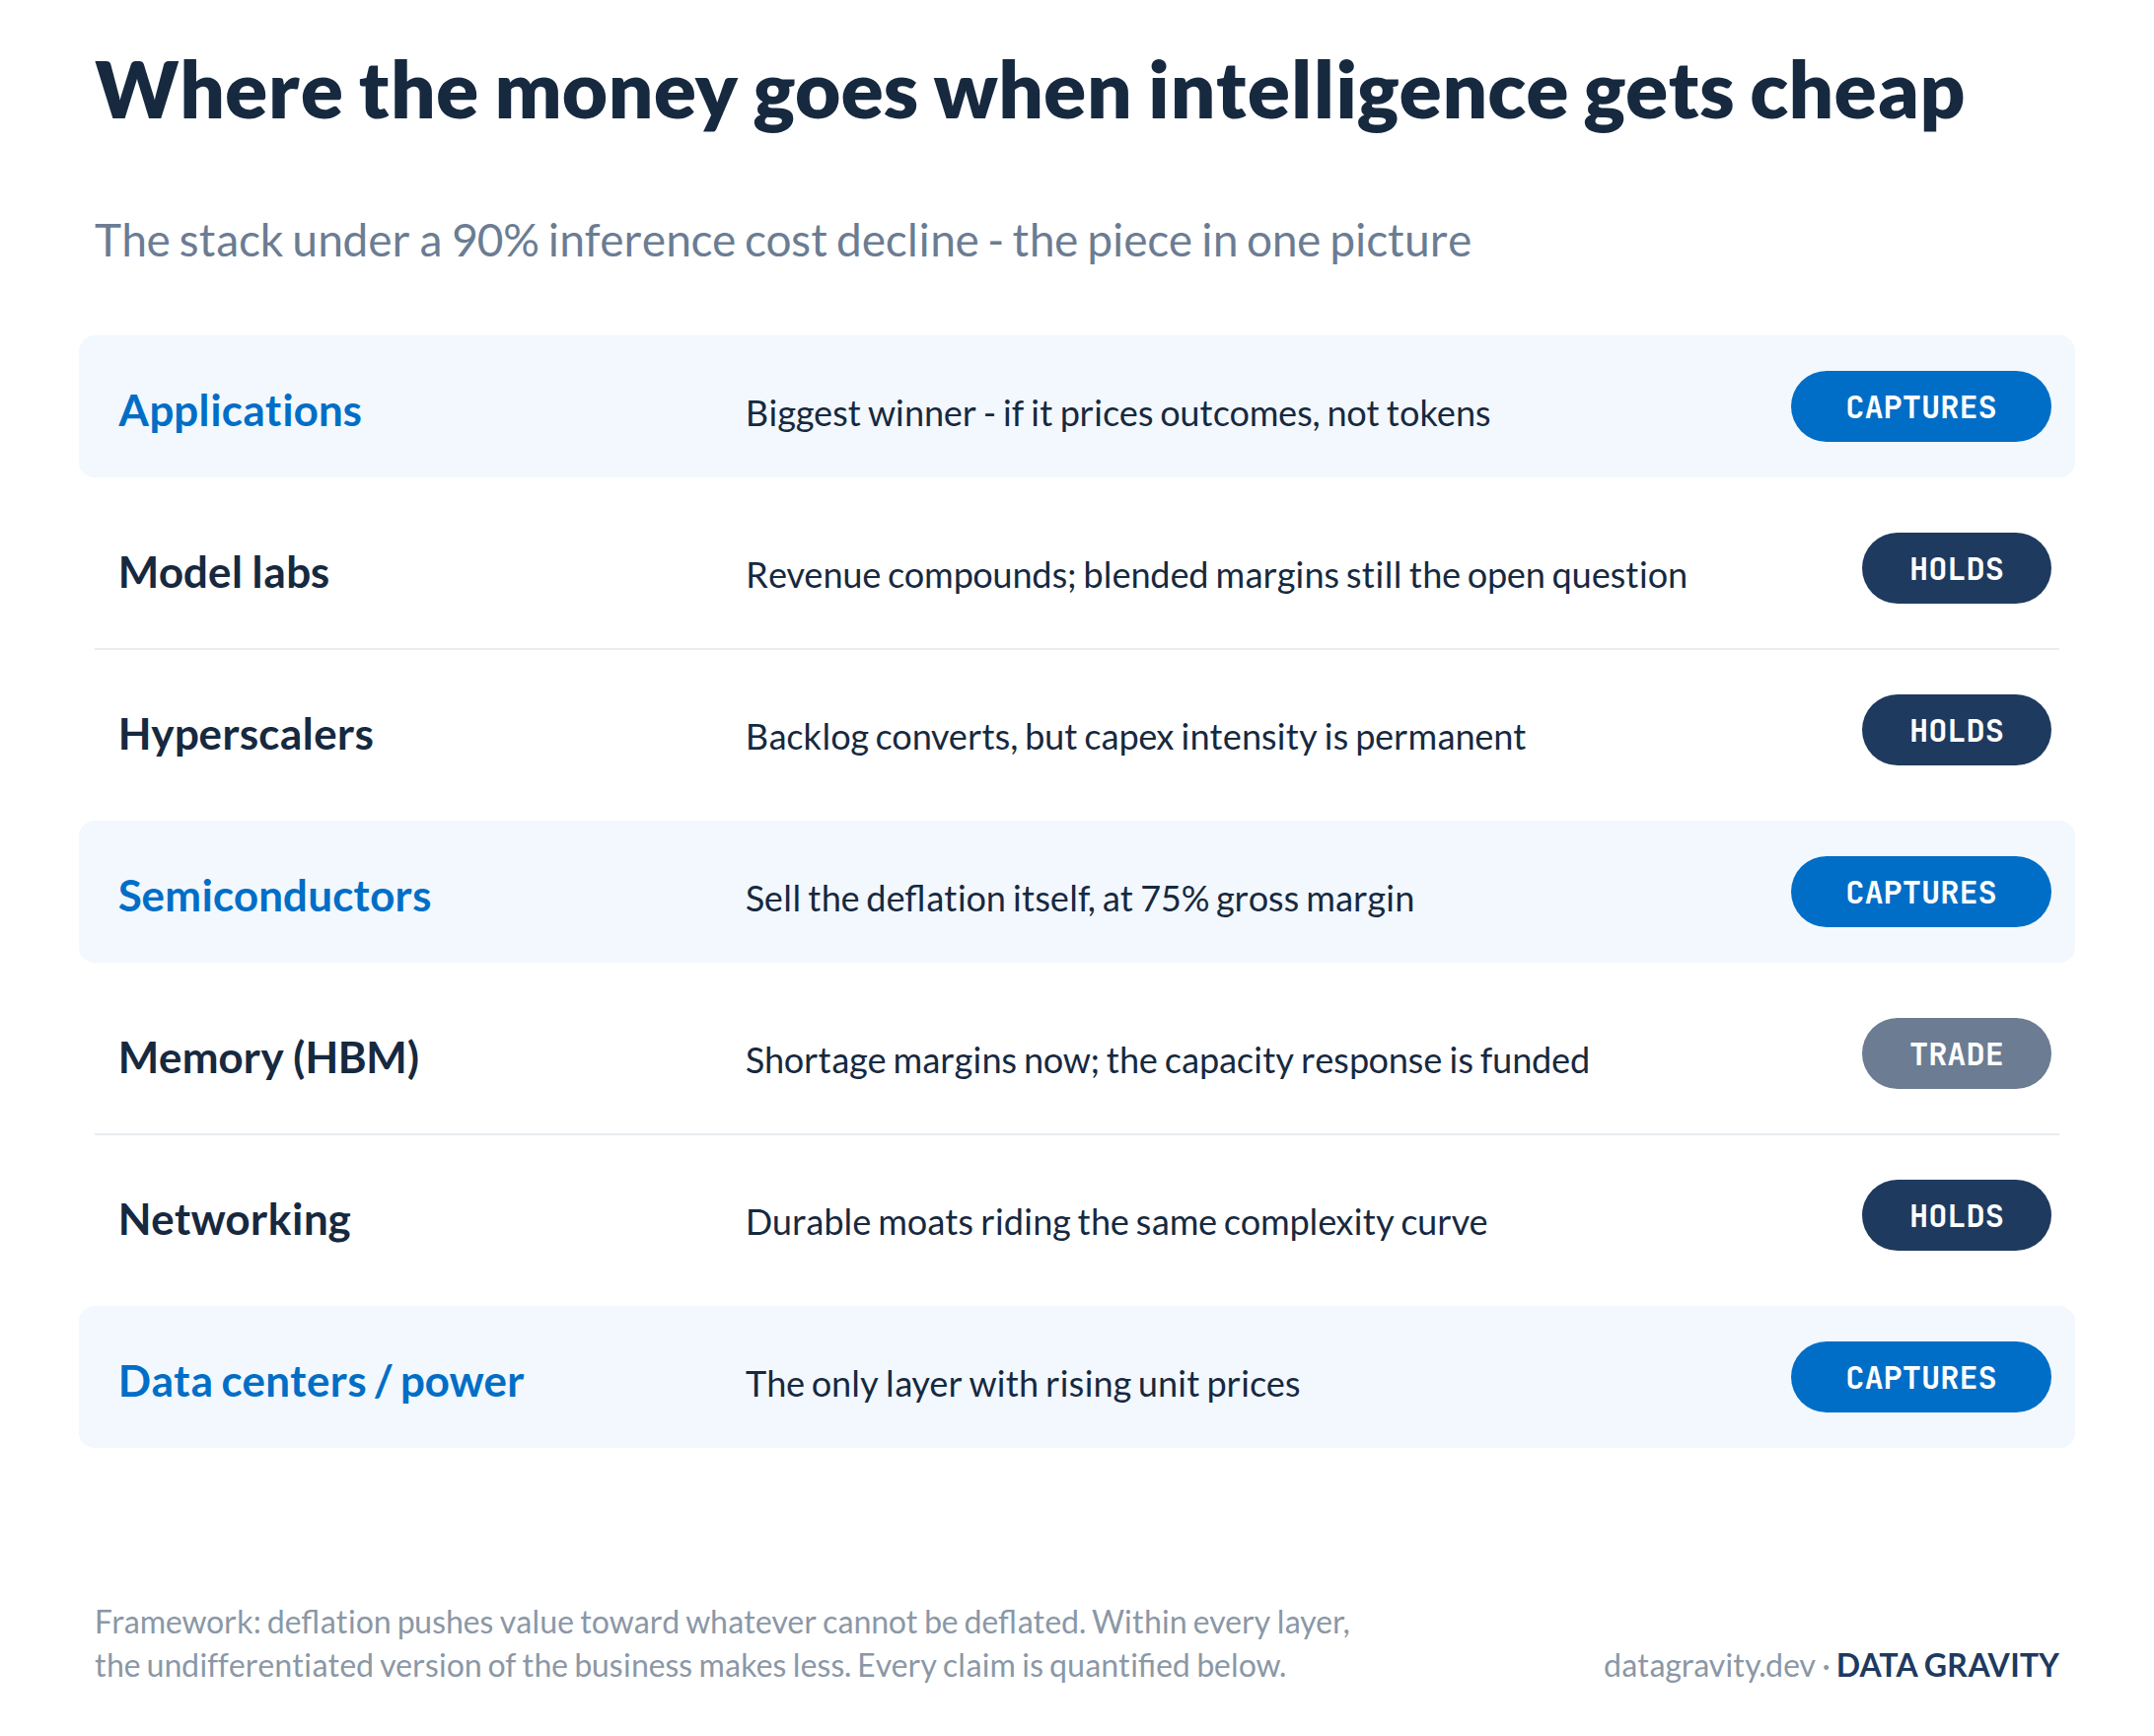
The verdict by layer. Every claim in this picture gets its numbers in the sections below.
The Demand Response
Everything in this piece rests on one question: when the price falls 90%, does total spending rise or fall? Paid demand answered first. OpenAI grew from $3.7 billion of revenue in 2024 to a reported $40 billion-plus run rate by August 2026. Anthropic went from a $1 billion run rate to a company-stated $47 billion, and both cut constant-capability prices the whole way. Enterprise generative AI spend hit $37 billion in 2025, up 3.2x (Menlo Ventures). OpenRouter’s paid, revenue-weighted traffic went from 5 trillion to 25 trillion weekly tokens in six months. A 10x price cut met a demand response larger than 10x at every layer where money changes hands. A caveat on that sentence: it stacks different measures (revenue, spend, tokens, orders), not a controlled demand curve, so it shows direction rather than a measured elasticity. Still, every proxy points the same way, and none point the other.
Google’s disclosures put the ceiling on the volume story: 9.7 trillion monthly tokens in May 2024, 480 trillion a year later, 3.2 quadrillion by May 2026. That is 330x in two years. Two caveats: the series includes free surfaces like AI Overviews, and Tom Tunguz noted monthly additions decelerated in late 2025 before reaccelerating. Treat it as the shape of consumption, not its price tag; the paid numbers carry the argument on their own.
The demand response also survived its cleanest natural experiment. DeepSeek’s January 2025 efficiency shock erased $589 billion of Nvidia’s market cap in a day on the thesis that efficiency kills demand. Eighteen months later, Nvidia’s order book had doubled to $1 trillion. Satya Nadella’s same-day line, “Jevons paradox strikes again,” is now the consensus view.
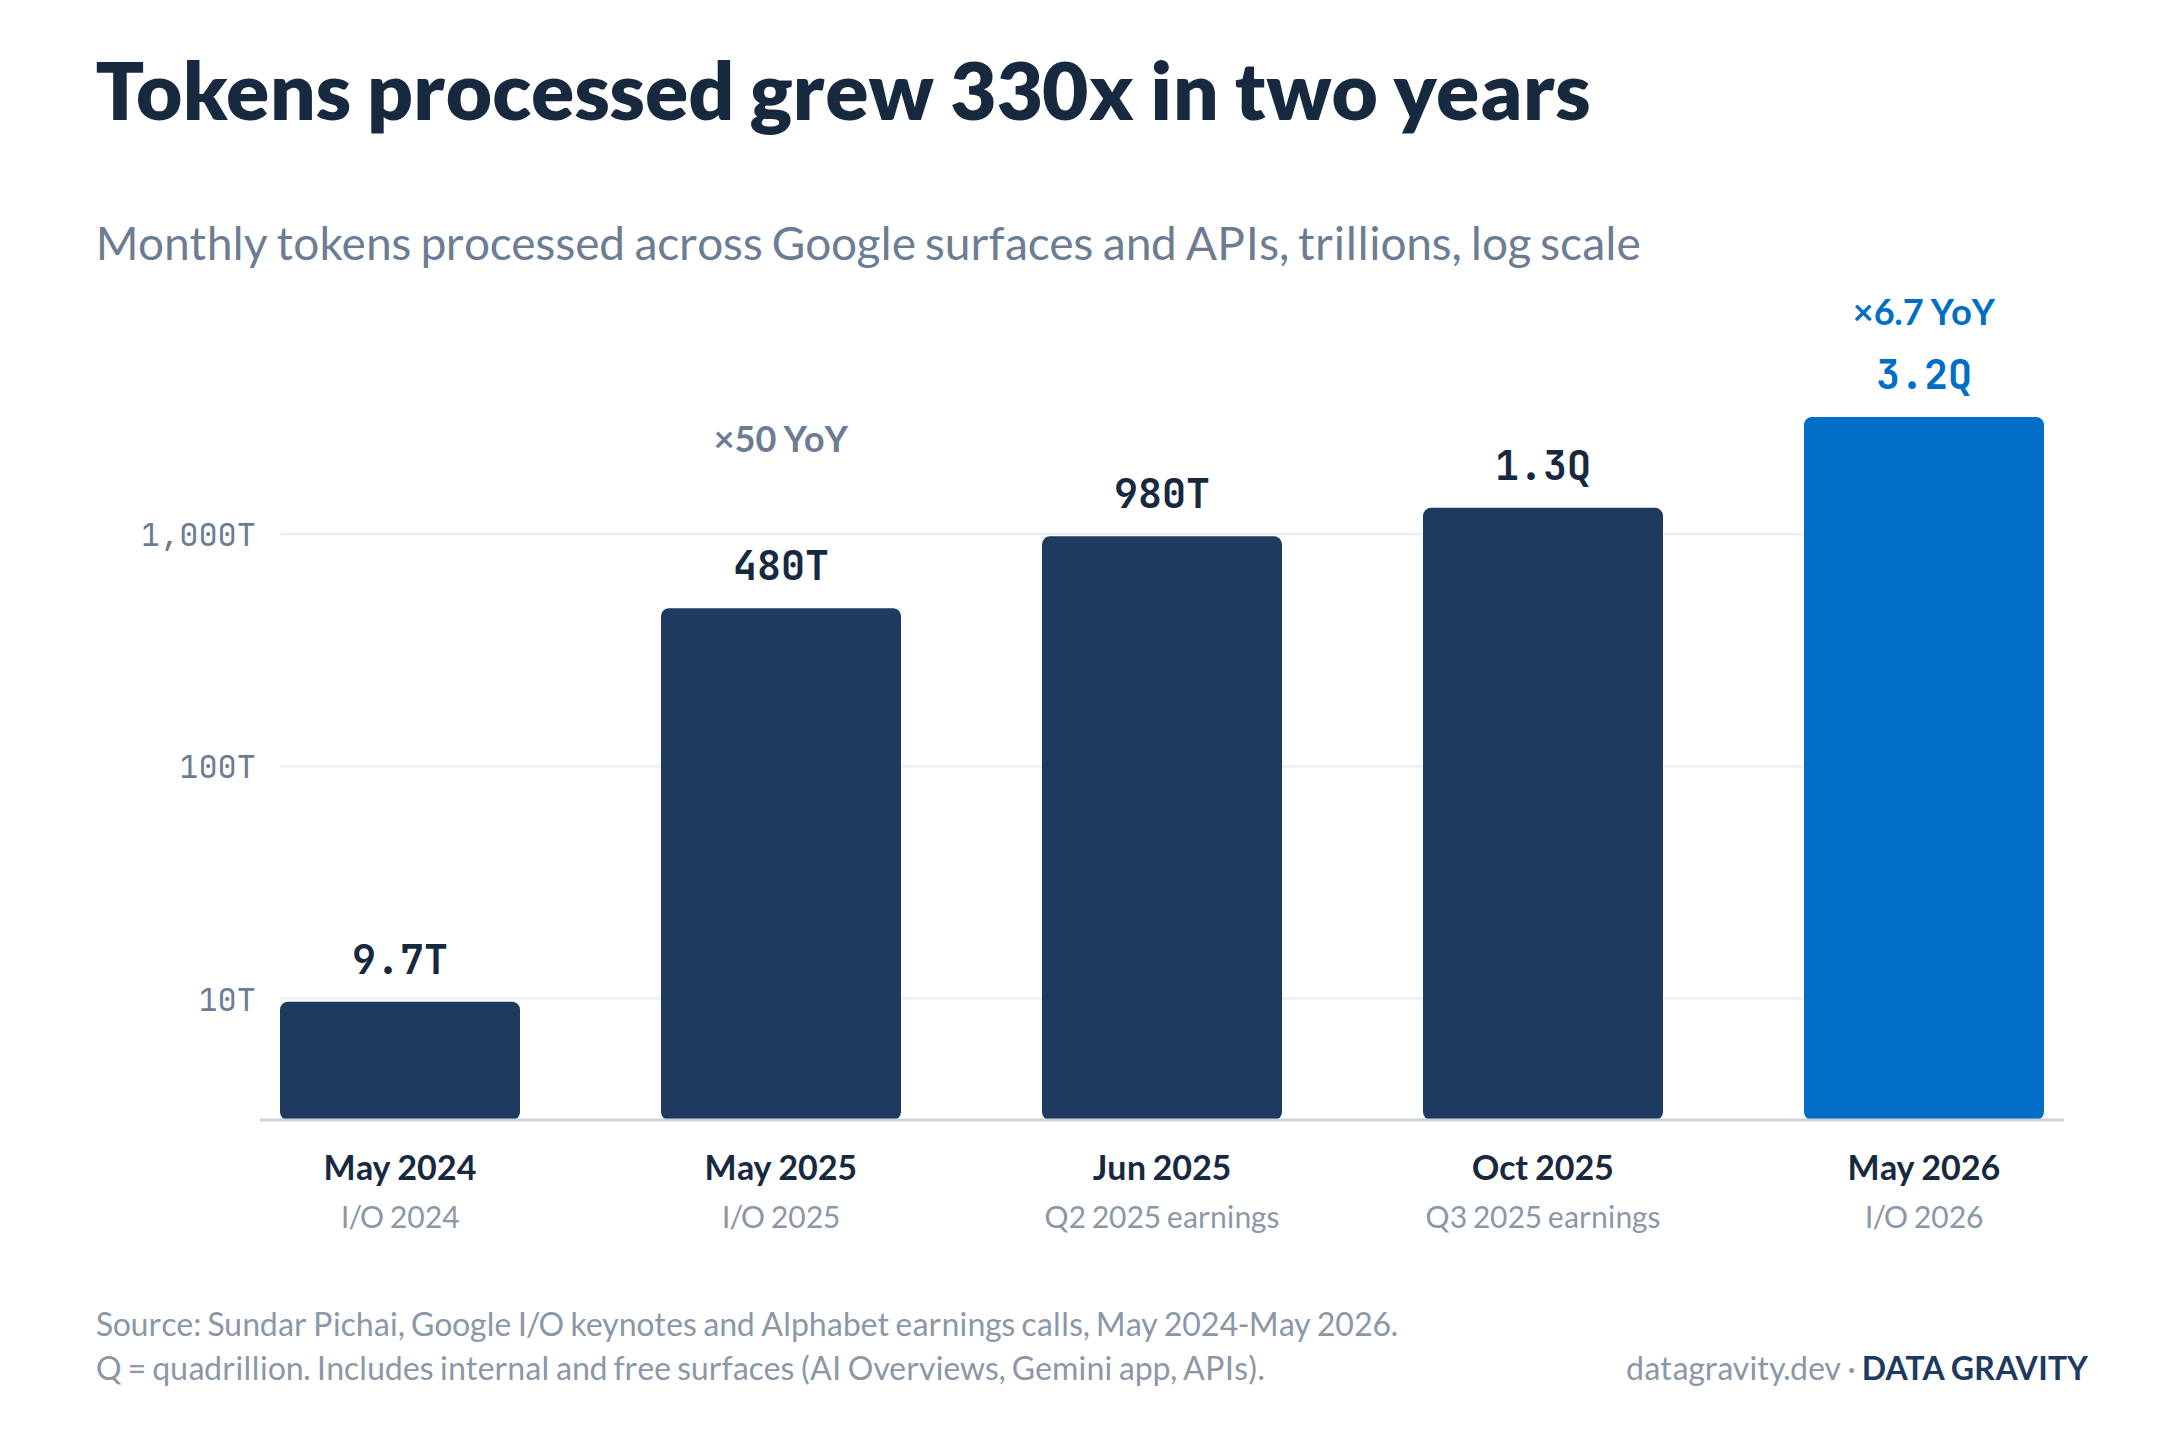
Google-disclosed monthly tokens across its surfaces and APIs, including free and internal ones. May 2026 is 330x the May 2024 baseline.
The subtler force: the task itself is inflating underneath the price cut. OpenRouter’s 100-trillion-token study measured it on paid traffic. Between late 2023 and late 2025, the median prompt quadrupled from about 1,500 tokens to over 6,000, completions tripled, reasoning models went from negligible to more than half of all tokens, and programming, the most token-dense workload, grew from 11% of volume to over 50%. Stanford’s Digital Economy Lab separately measured agentic coding tasks at roughly 1,000x the tokens of a code-chat query.
Cheaper tokens do not just mean more queries. They mean each query is allowed to think longer. Inference-time scaling made tokens-per-task a design variable, and memory, networking, and power all inherit the consequence.
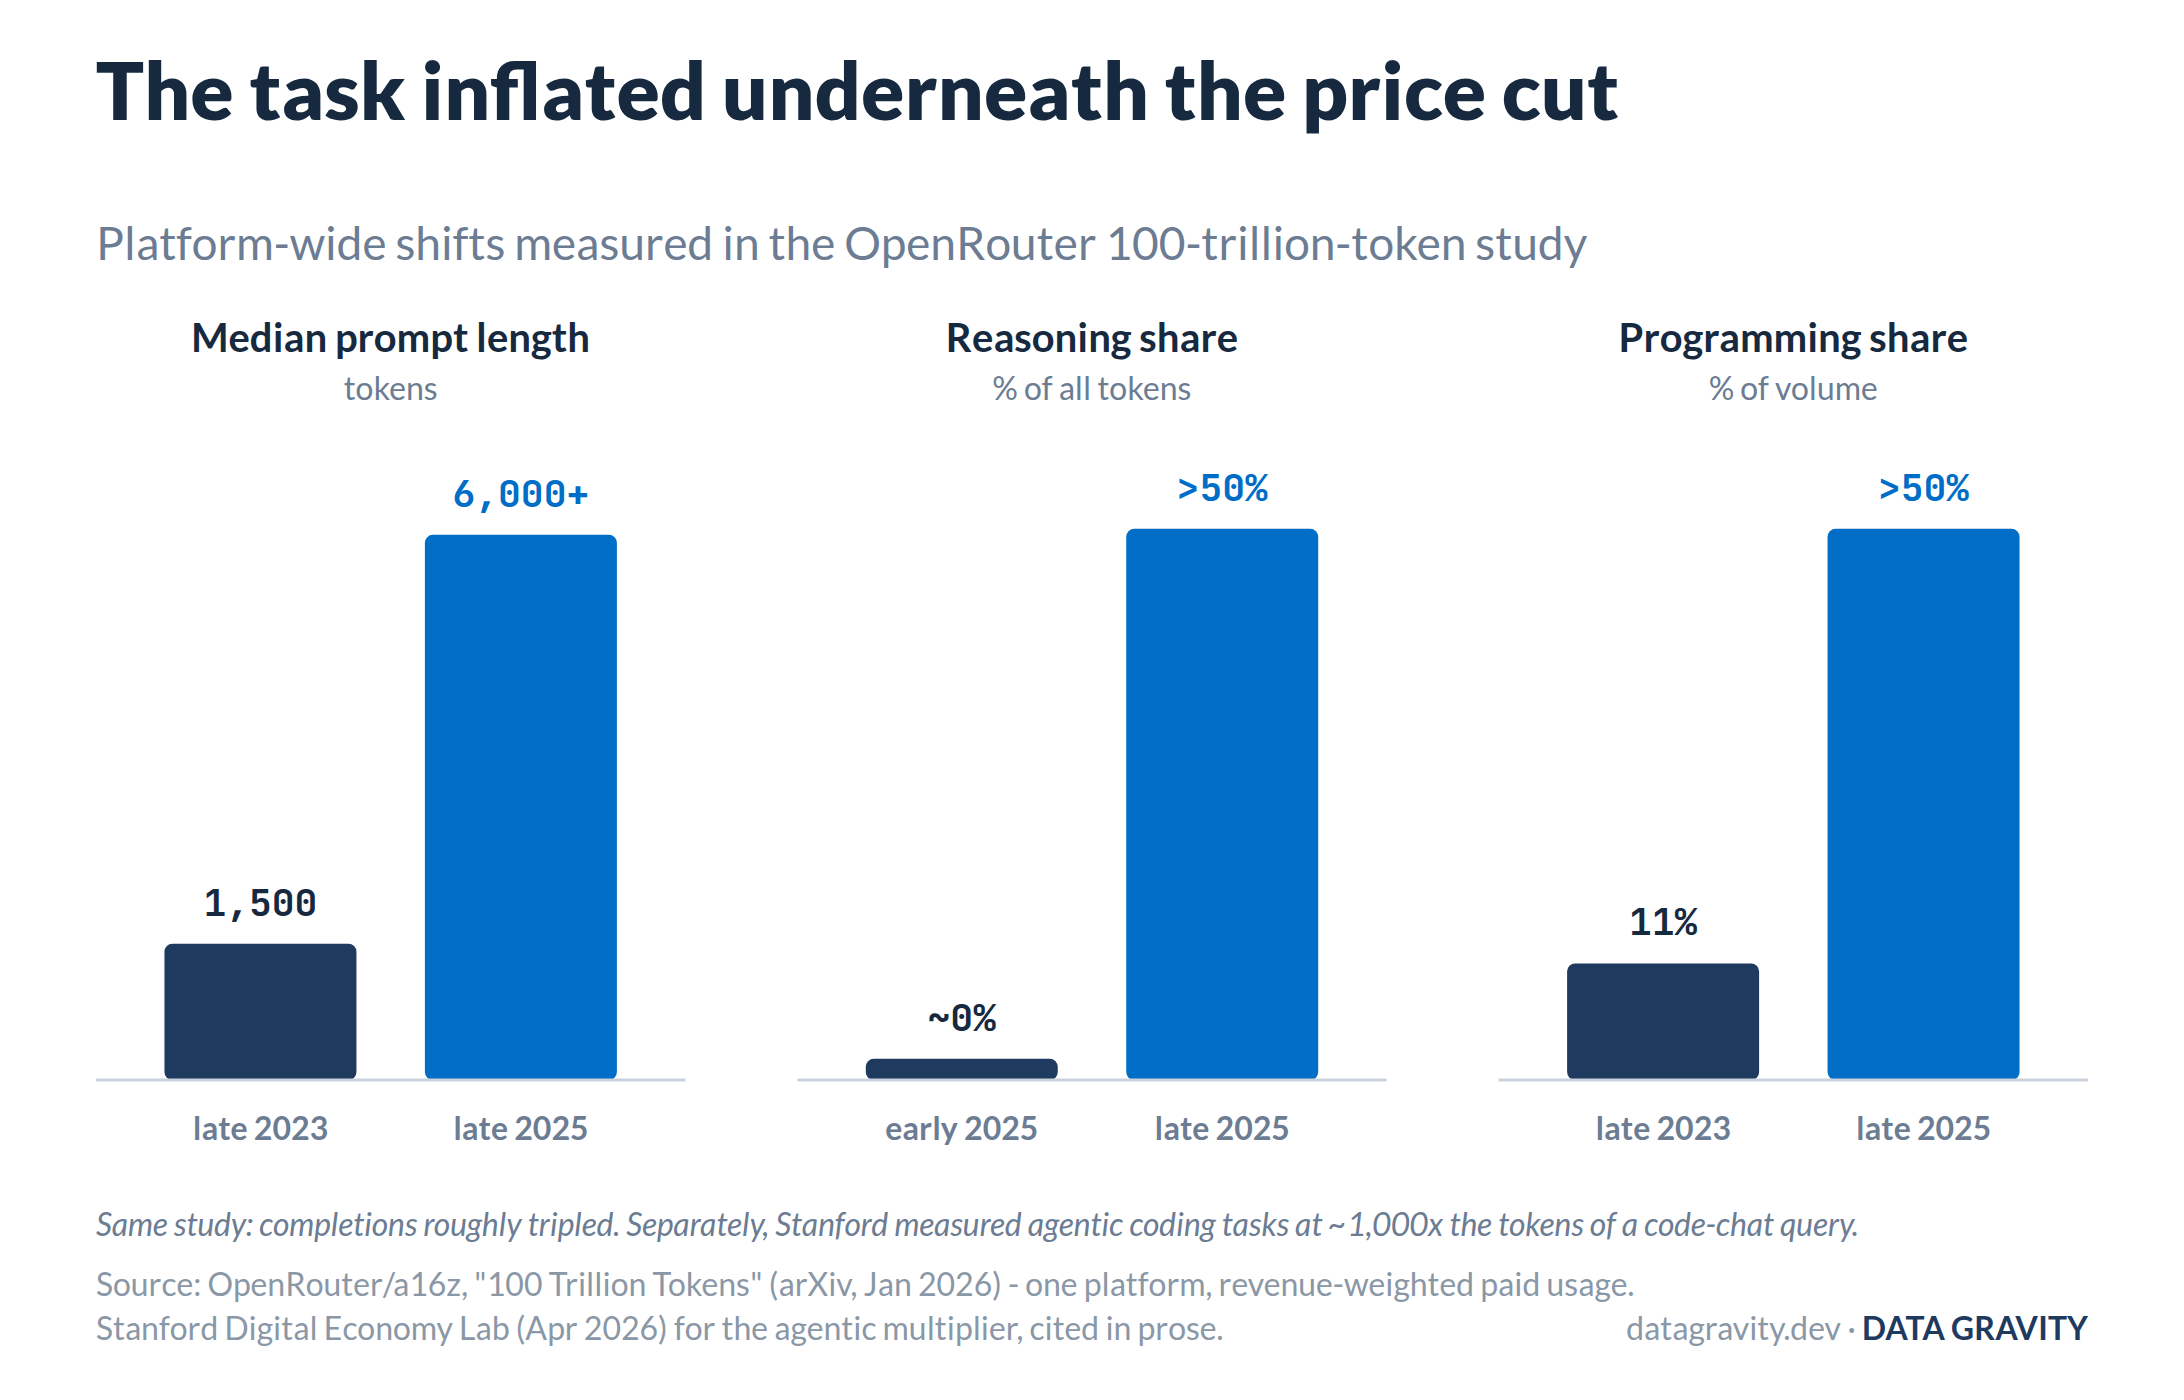
Paid-usage shifts from the OpenRouter study: prompts 4x longer, reasoning from near zero to a majority of tokens, programming from 11% to over half of volume.
Model Labs: Volume Wins, Margins Turning
The 10x discount applies to last year’s capability, never the frontier. OpenAI’s flagship launch price ran $30 (GPT-4), $10 (Turbo), $5 (4o), $1.25 (GPT-5). Then it turned back up, with GPT-5.5 tracking around $5 on third-party trackers. Ethan Ding made the canonical argument in mid-2025: frontier prices stay roughly flat, trailing prices collapse, and demand keeps migrating to the frontier. Menlo’s survey data confirms it. 66% of enterprise workloads upgrade to the newest model within months, only 11% switch vendors to save money, and open-source share fell from 19% to 13% despite far lower prices. Buyers pay for capability, not tokens.
That is the labs’ entire margin defense, and it has held revenue up. OpenAI went $3.7 billion to $13 billion to a reported $40 billion-plus run rate. Anthropic went $1 billion to $47 billion in seventeen months, company-stated and unaudited until the S-1s publish. Growing revenue an order of magnitude while cutting prices an order of magnitude is not a theory of elasticity. It is the income statement.
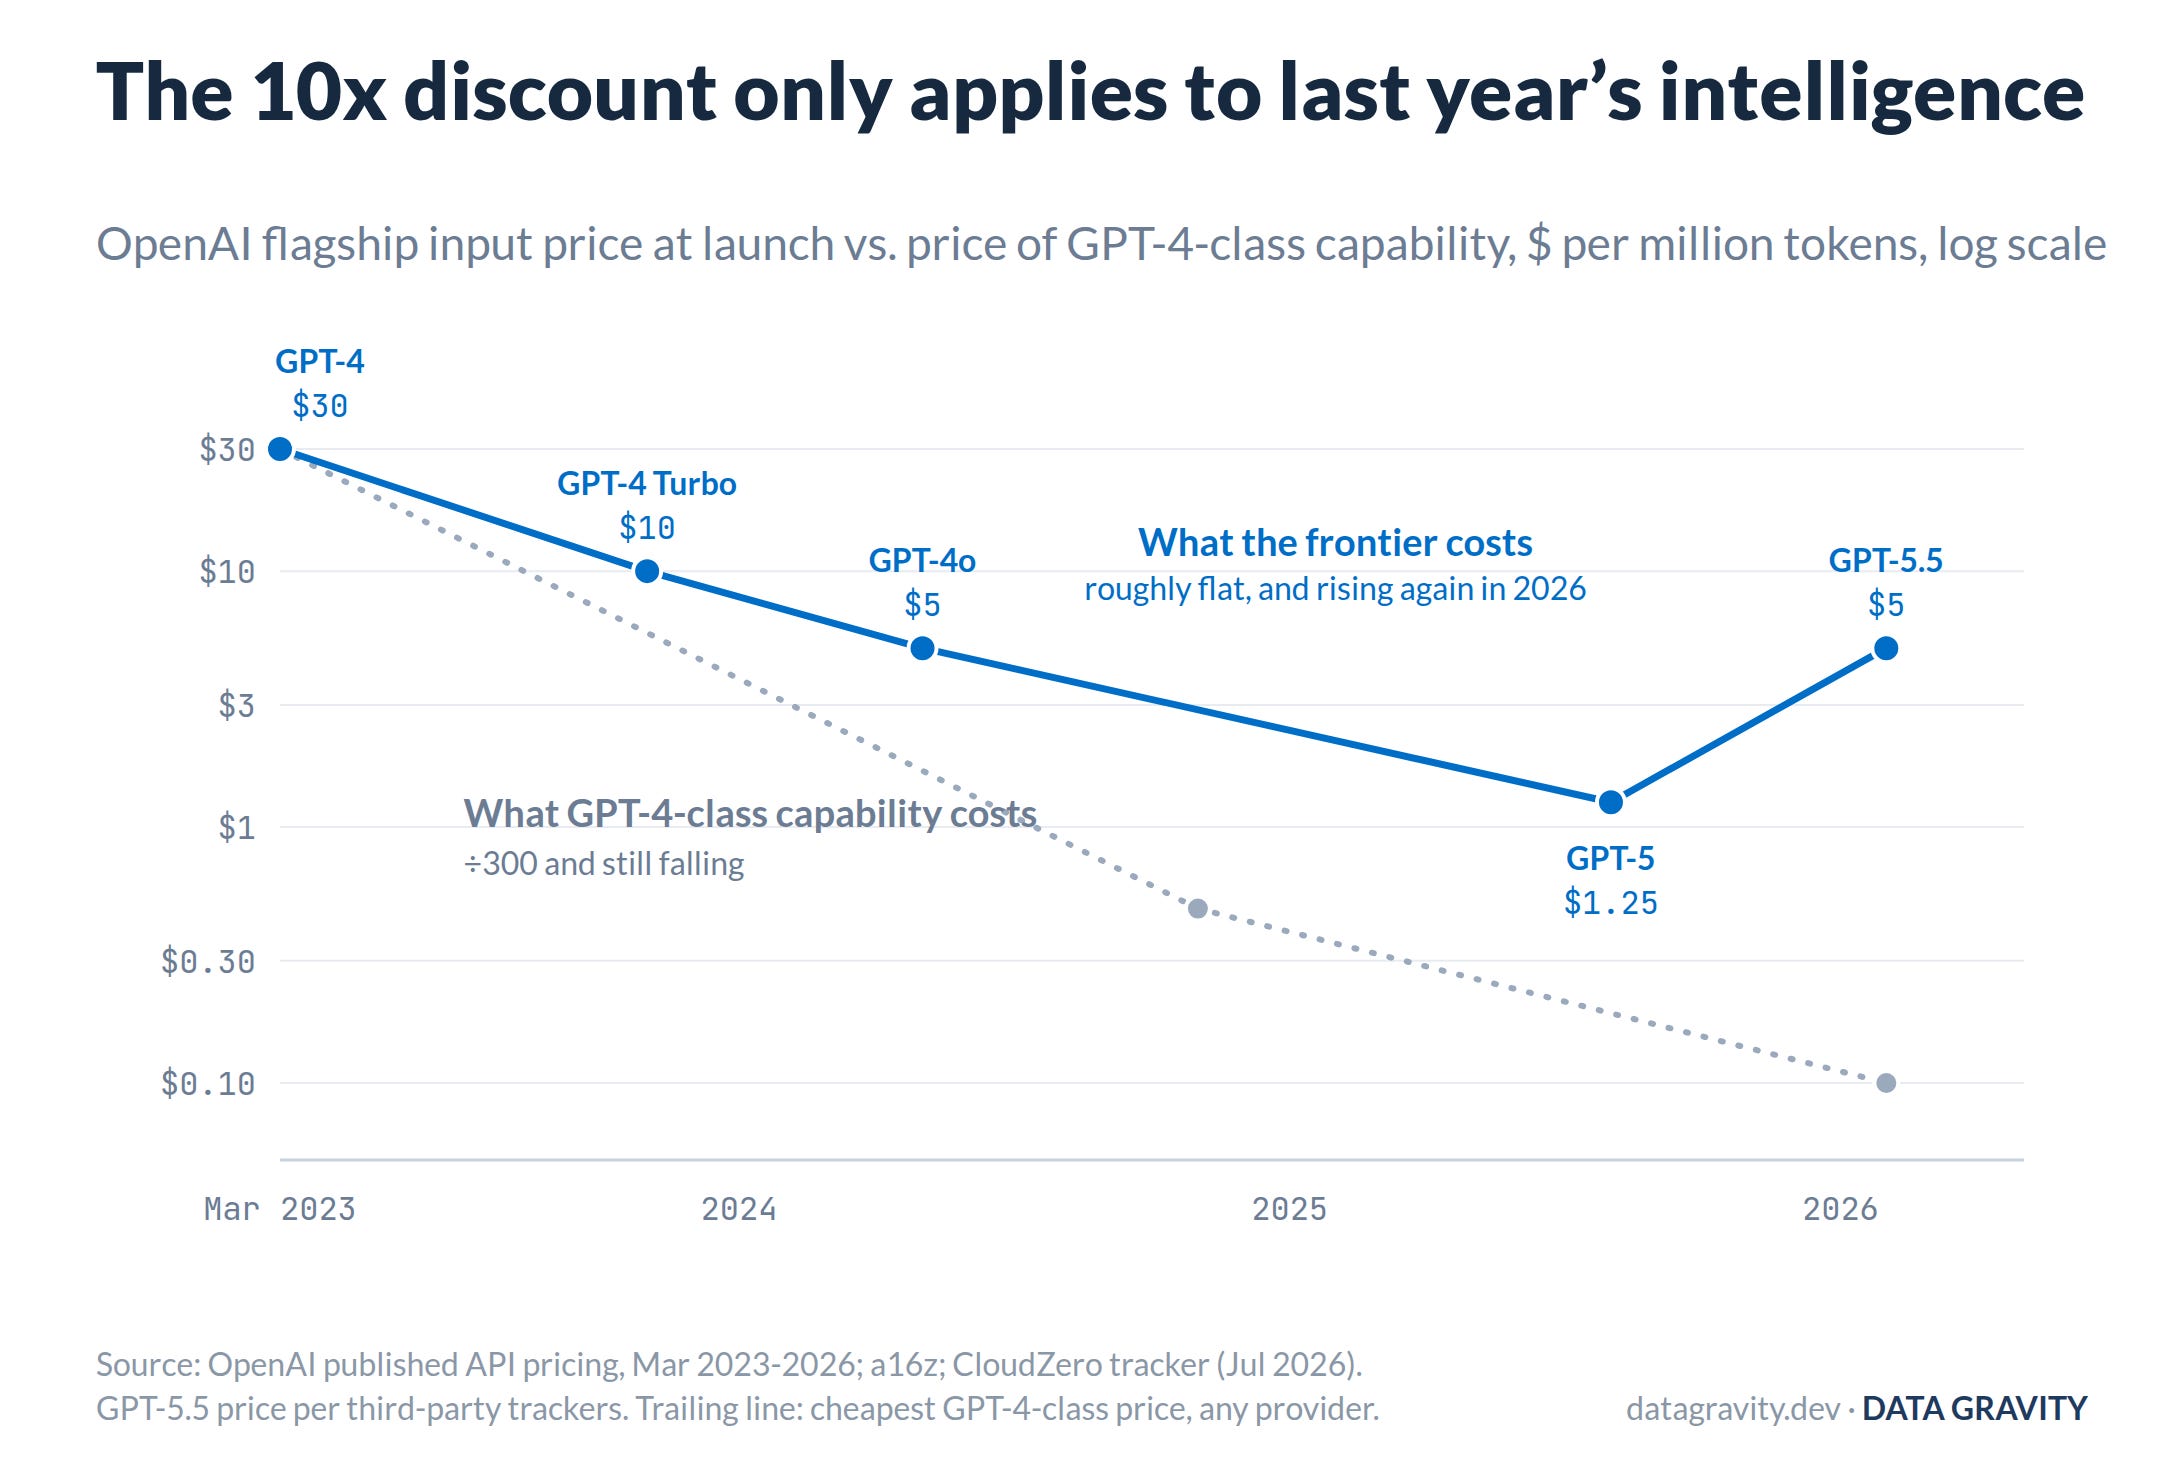
OpenAI flagship launch pricing against the cheapest GPT-4-class price from any provider. The discount applies to trailing capability; the frontier repriced upward in 2026.
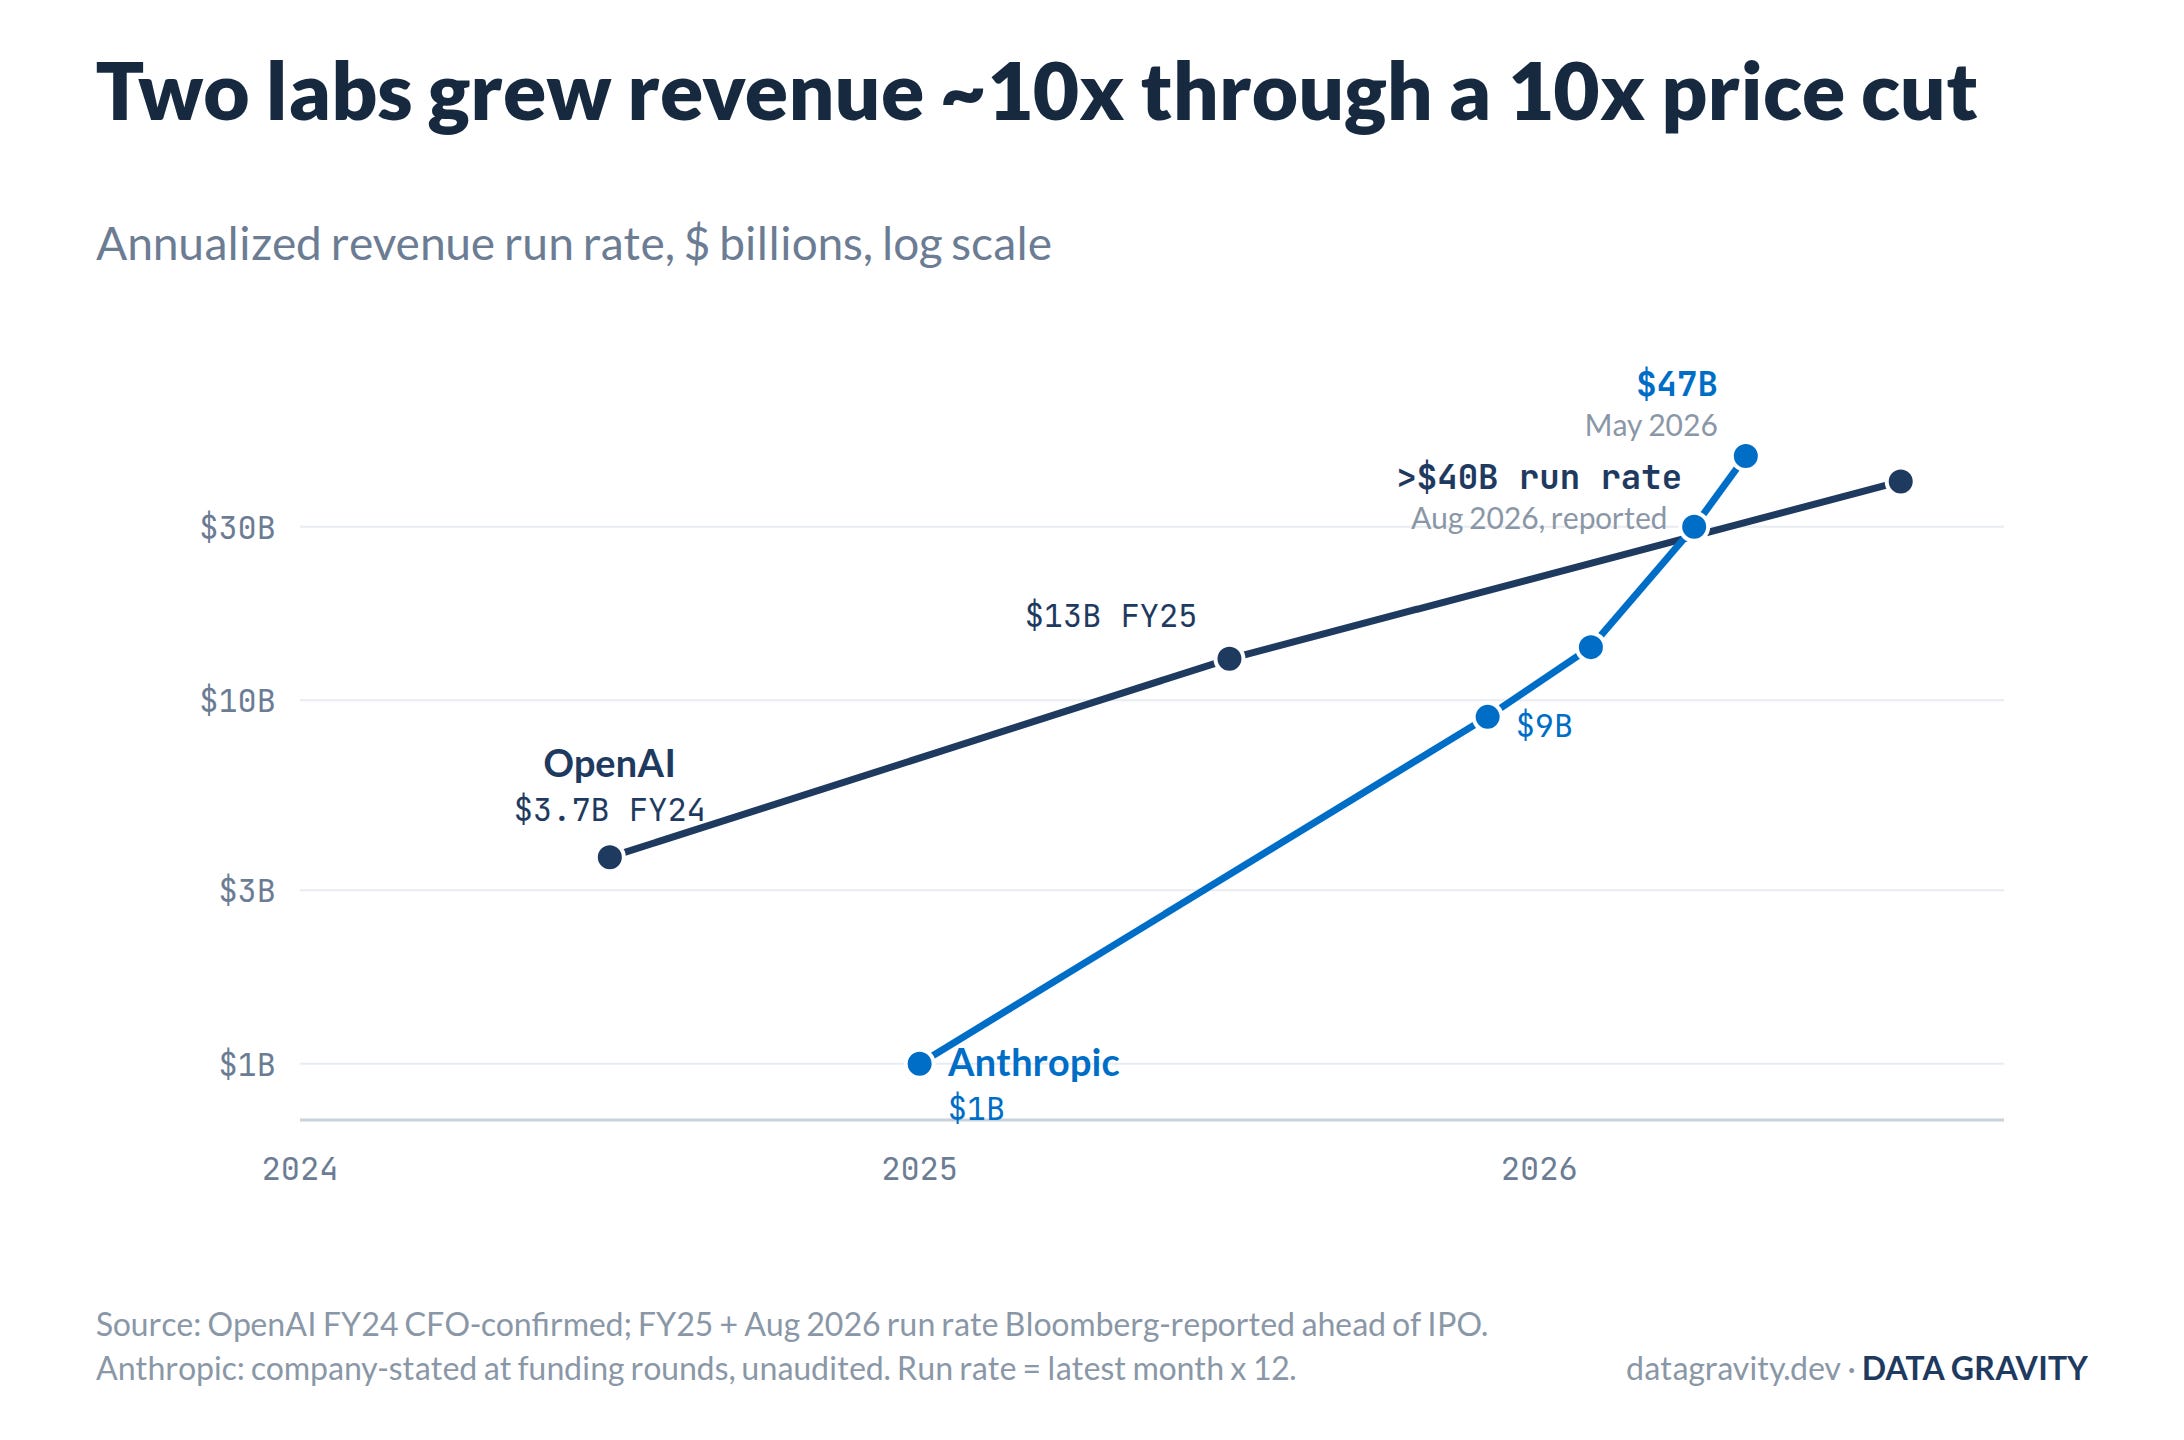
OpenAI and Anthropic revenue trajectories, 2024-2026. Both labs cut constant-capability prices throughout this window.
Margins took longer. Reported figures, none company-published, put OpenAI around 40% gross in 2024 and 33% in 2025, missing its own 46% forecast. Anthropic ran -94% in 2024 and about 40% in 2025. Then the deflation reached the serving line: SemiAnalysis pegs Anthropic’s inference margin (revenue minus serving compute) at roughly 70% by mid-2026, up from 38% a year earlier, the same trajectory PitchBook’s compute-cost numbers trace ($0.71 per $1 of revenue in Q1, $0.56 projected in Q2). Inference margin is a narrower measure than blended gross margin; it excludes training amortization and free tiers. But the direction is the story: the serving business is compounding toward software economics on schedule with the hardware.
What remains unpaid is everything above the serving line: the frontier treadmill (each flagship costs more to train), reasoning-token inflation on the growth products, and free tiers at planetary scale. That is now the real race, a serving margin that improves with every hardware generation against training bills that scale with ambition. OpenAI’s internal 2030 target is reportedly 60%+ blended gross margin on ~$85 billion of inference spend; PitchBook’s bear case compresses Anthropic’s valuation 70-81% if blended margins stall below 35%. The mid-2026 serving data says the flywheel is turning. The S-1s will say how fast, and roughly $1.4 trillion of OpenAI data center commitments ride on the answer.
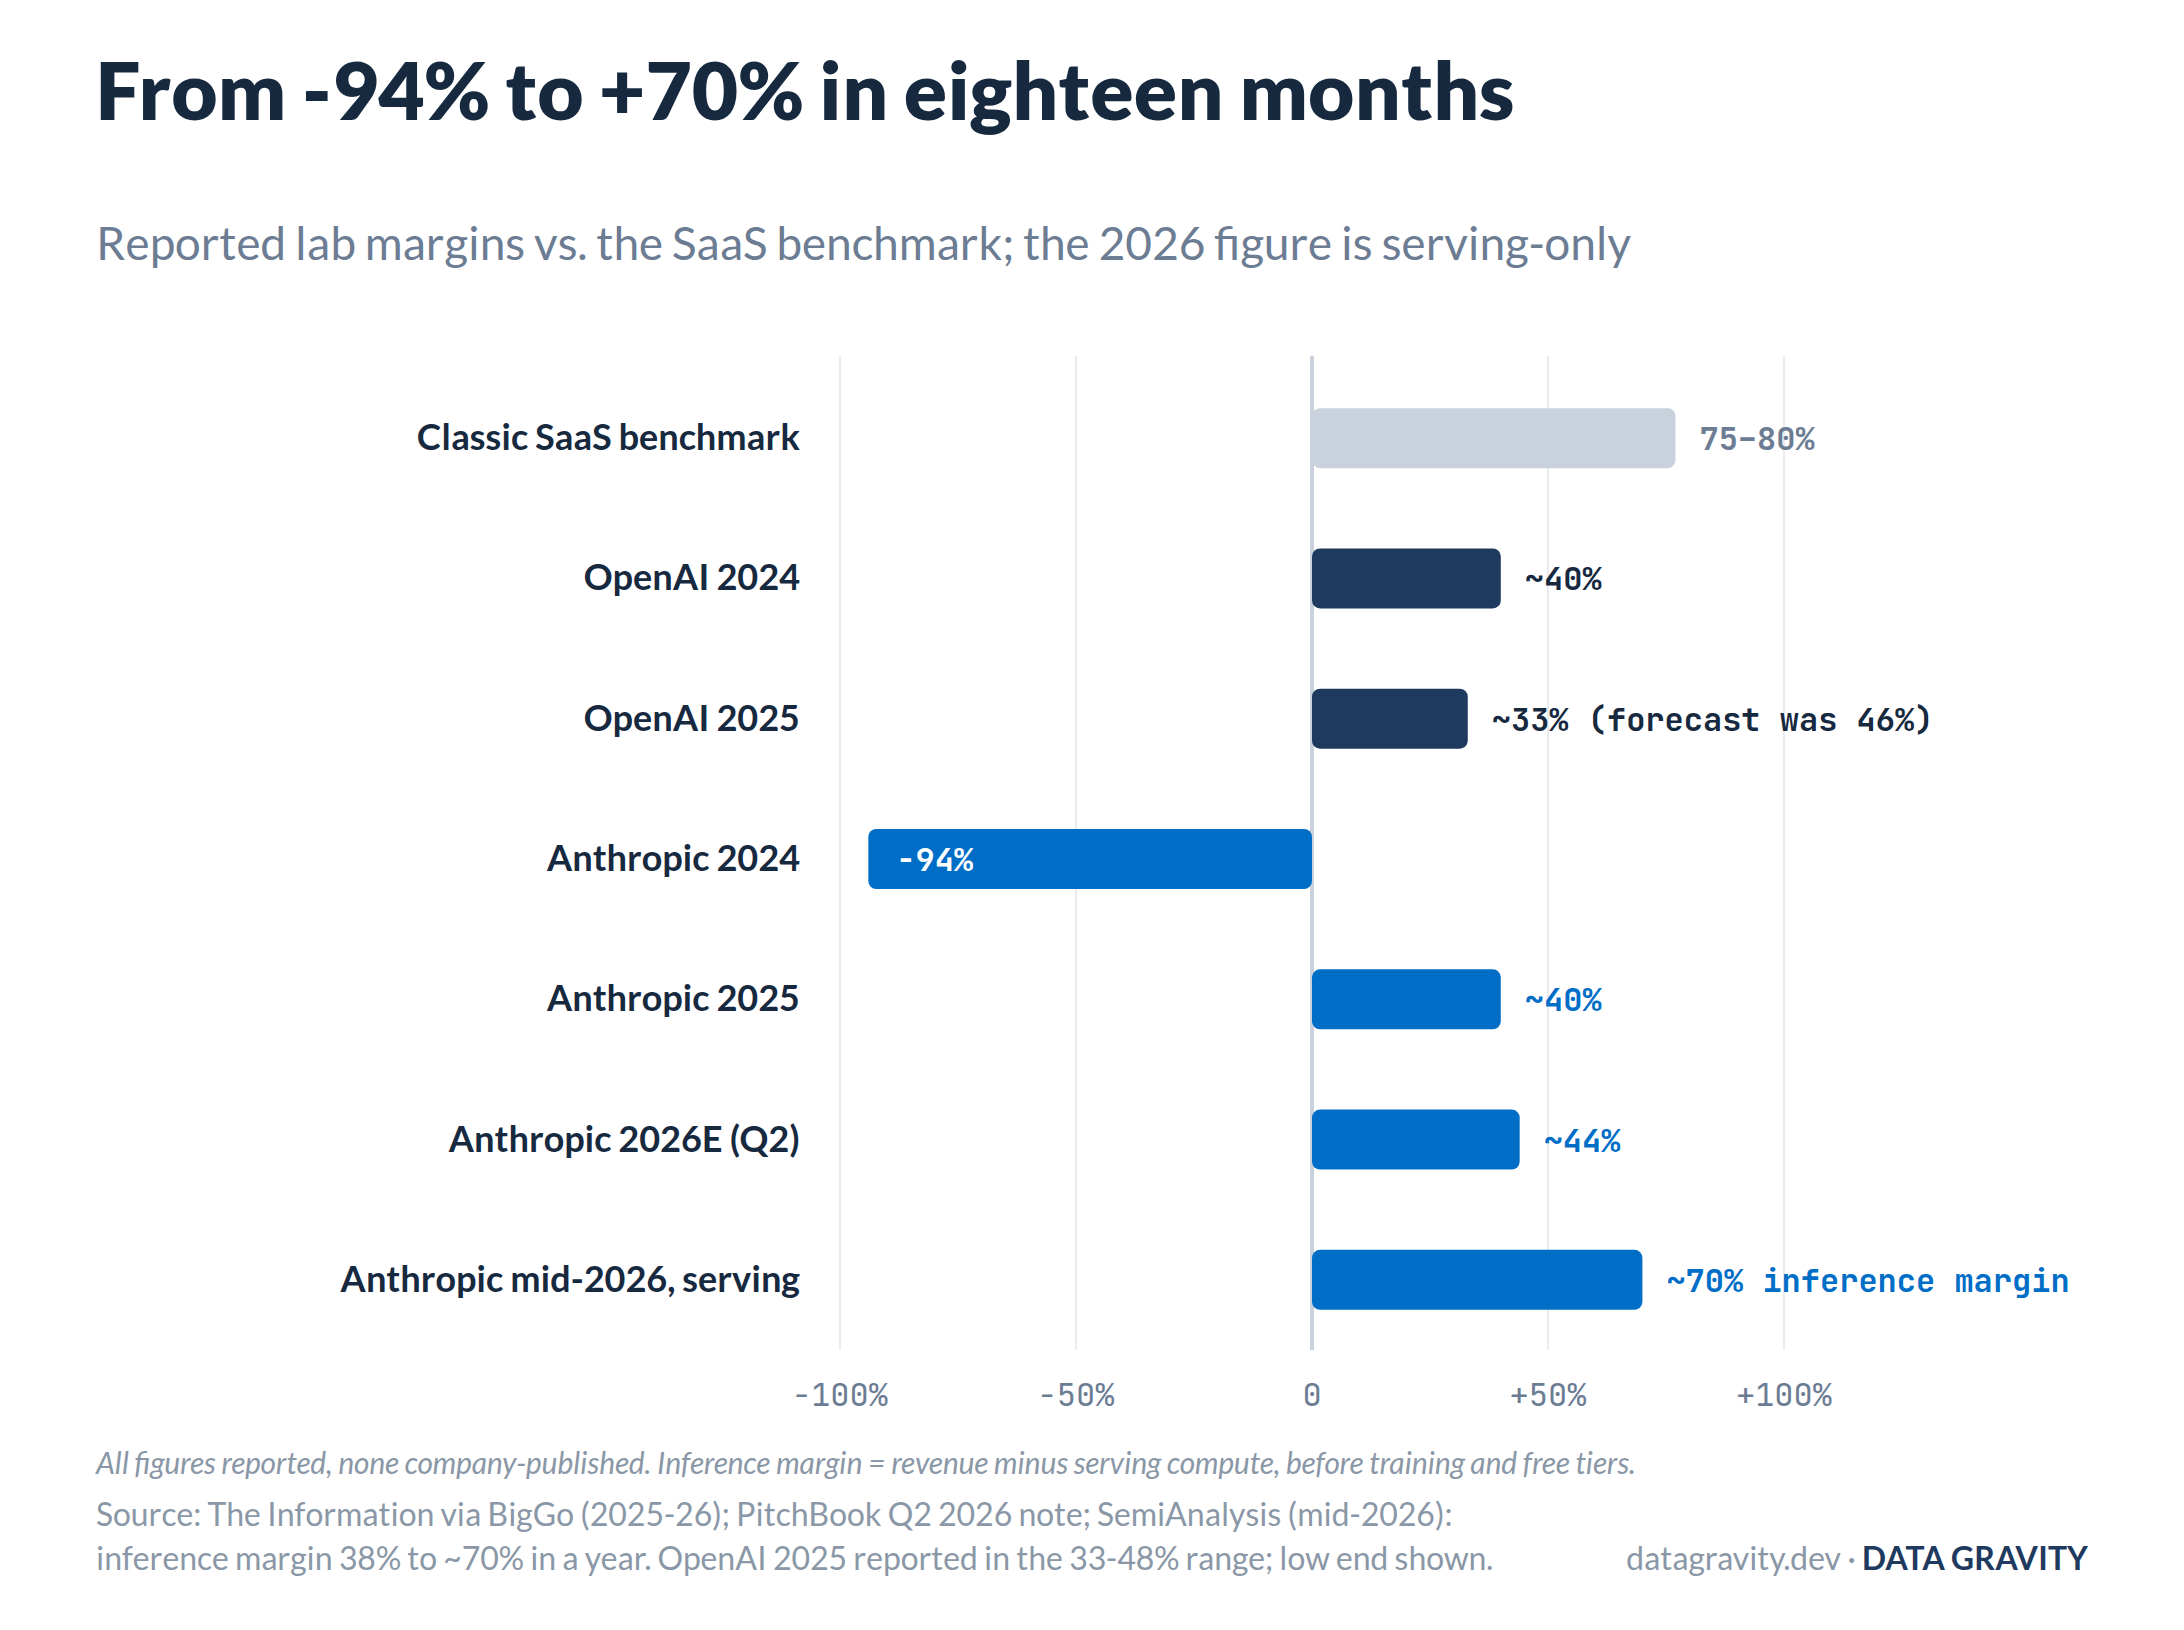
Reported lab margins against the 75-80% software benchmark. The 2026 Anthropic figure is inference margin (SemiAnalysis), serving compute only, not comparable to the blended figures. All press-reported.
Applications: The Biggest Beneficiary, Conditionally
A 90% price cut is a COGS windfall for the layer already growing faster than any software cohort in history. Cursor: $100 million to a reported $3 billion of annualized revenue in seventeen months. Lovable: $100 million within eight months of launch, $400 million by February 2026, with 146 employees. Claude Code: $1 billion roughly six months after general availability. Harvey $190 million, Glean $200 million, Sierra $100 million in 21 months. Enterprise application spend reached $19 billion in 2025, larger for the first time than the model spend beneath it.
The margins tell the other half. Cursor reportedly ran -23% gross for the quarter ended January 2026. Perplexity’s 2024 compute and model spend came to 164% of revenue. Replit swung between -14% and +36%, and Windsurf’s margin was described to TechCrunch as “very negative.” The cause is the treadmill: apps that compete on capability must serve the frontier, and the frontier never gets cheaper. The 10x discount goes only to products willing to run last year’s intelligence. In coding, Menlo pegs one vendor’s models at 42% of usage, so the category’s COGS is close to a single supplier’s price list.
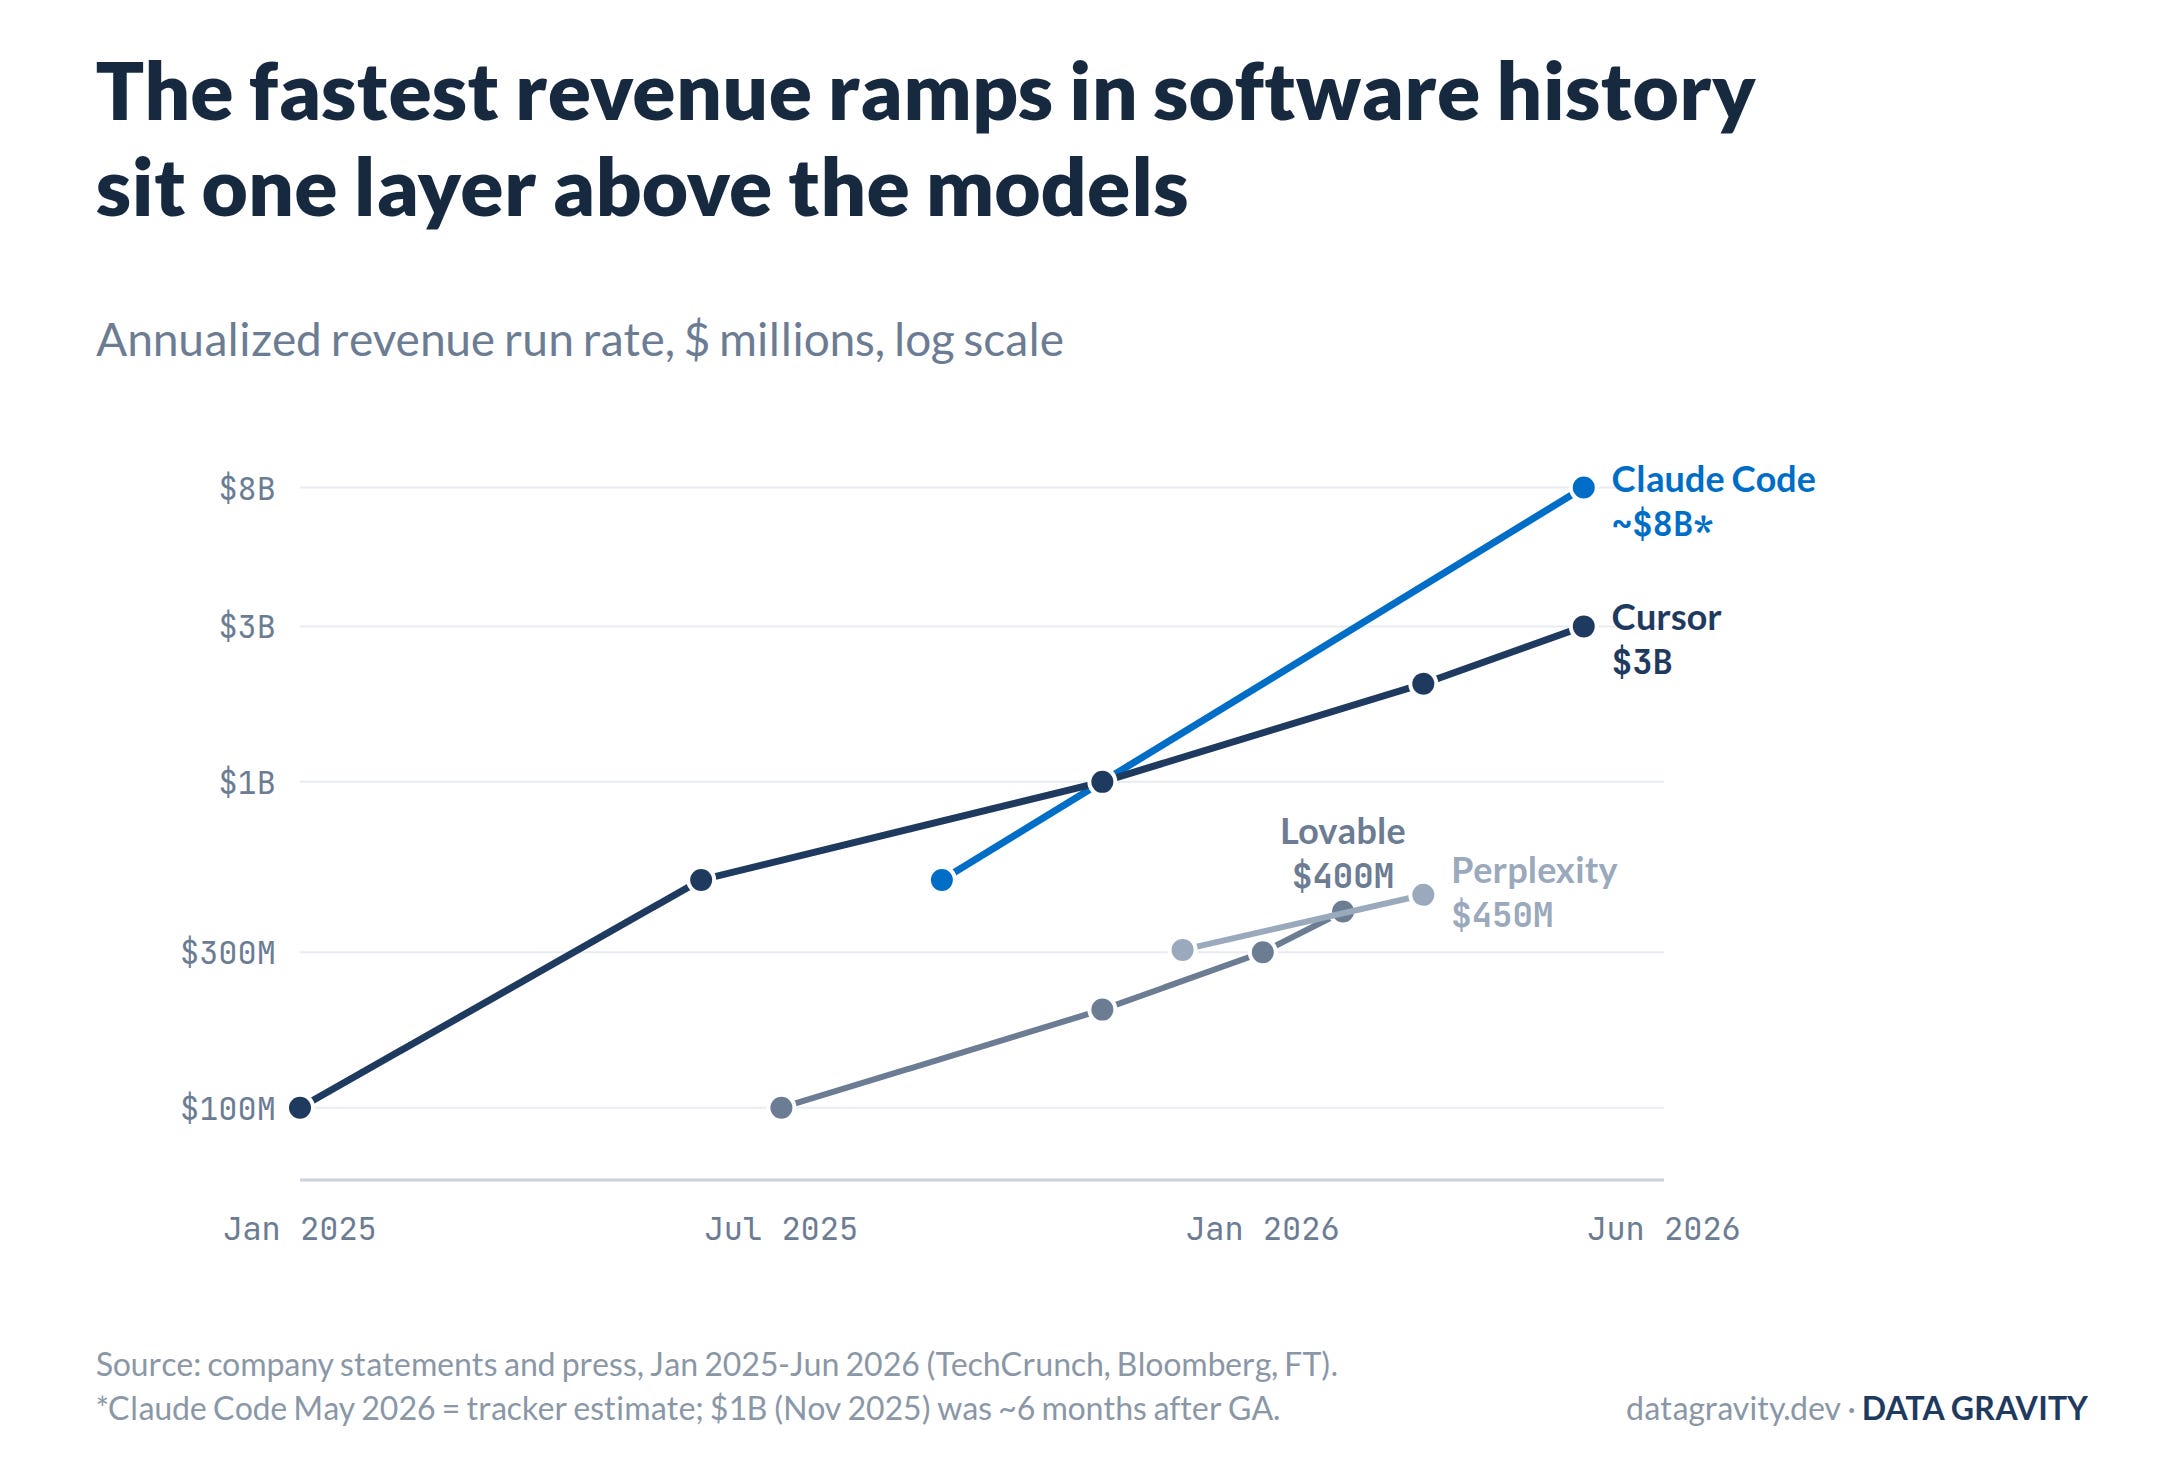
Revenue ramps, January 2025 to June 2026. Cursor reached $2B annualized faster than any B2B software company on record.
Margin relief is a choice, not a default. Notion cut AI unit costs about 3x in two years by routing between commodity and frontier models per task. Cursor reportedly reached slight gross profitability in April 2026 on Composer, its in-house model serving the 80% of requests that do not need the frontier. Sierra prices per resolved issue, and Intercom’s Fin charges $0.99 per resolution, structures that charge for the outcome and pocket every future cost decline. a16z’s Sarah Wang now calls sky-high gross margins an “orange flag” for AI apps, a sign of too little AI in the product. That position only makes sense because the input curve falls 10x a year.
If inference falls another 10x, no layer gains more. Negative-23% at today’s prices is strongly positive at a tenth of them, provided tokens-per-task does not eat the decline, and outcome-priced agents convert deflation straight into gross profit. The apps that survive the next two years of negative margins inherit the best cost curve in software history. The ones pricing seats against frontier COGS will keep shipping their margin upstream.
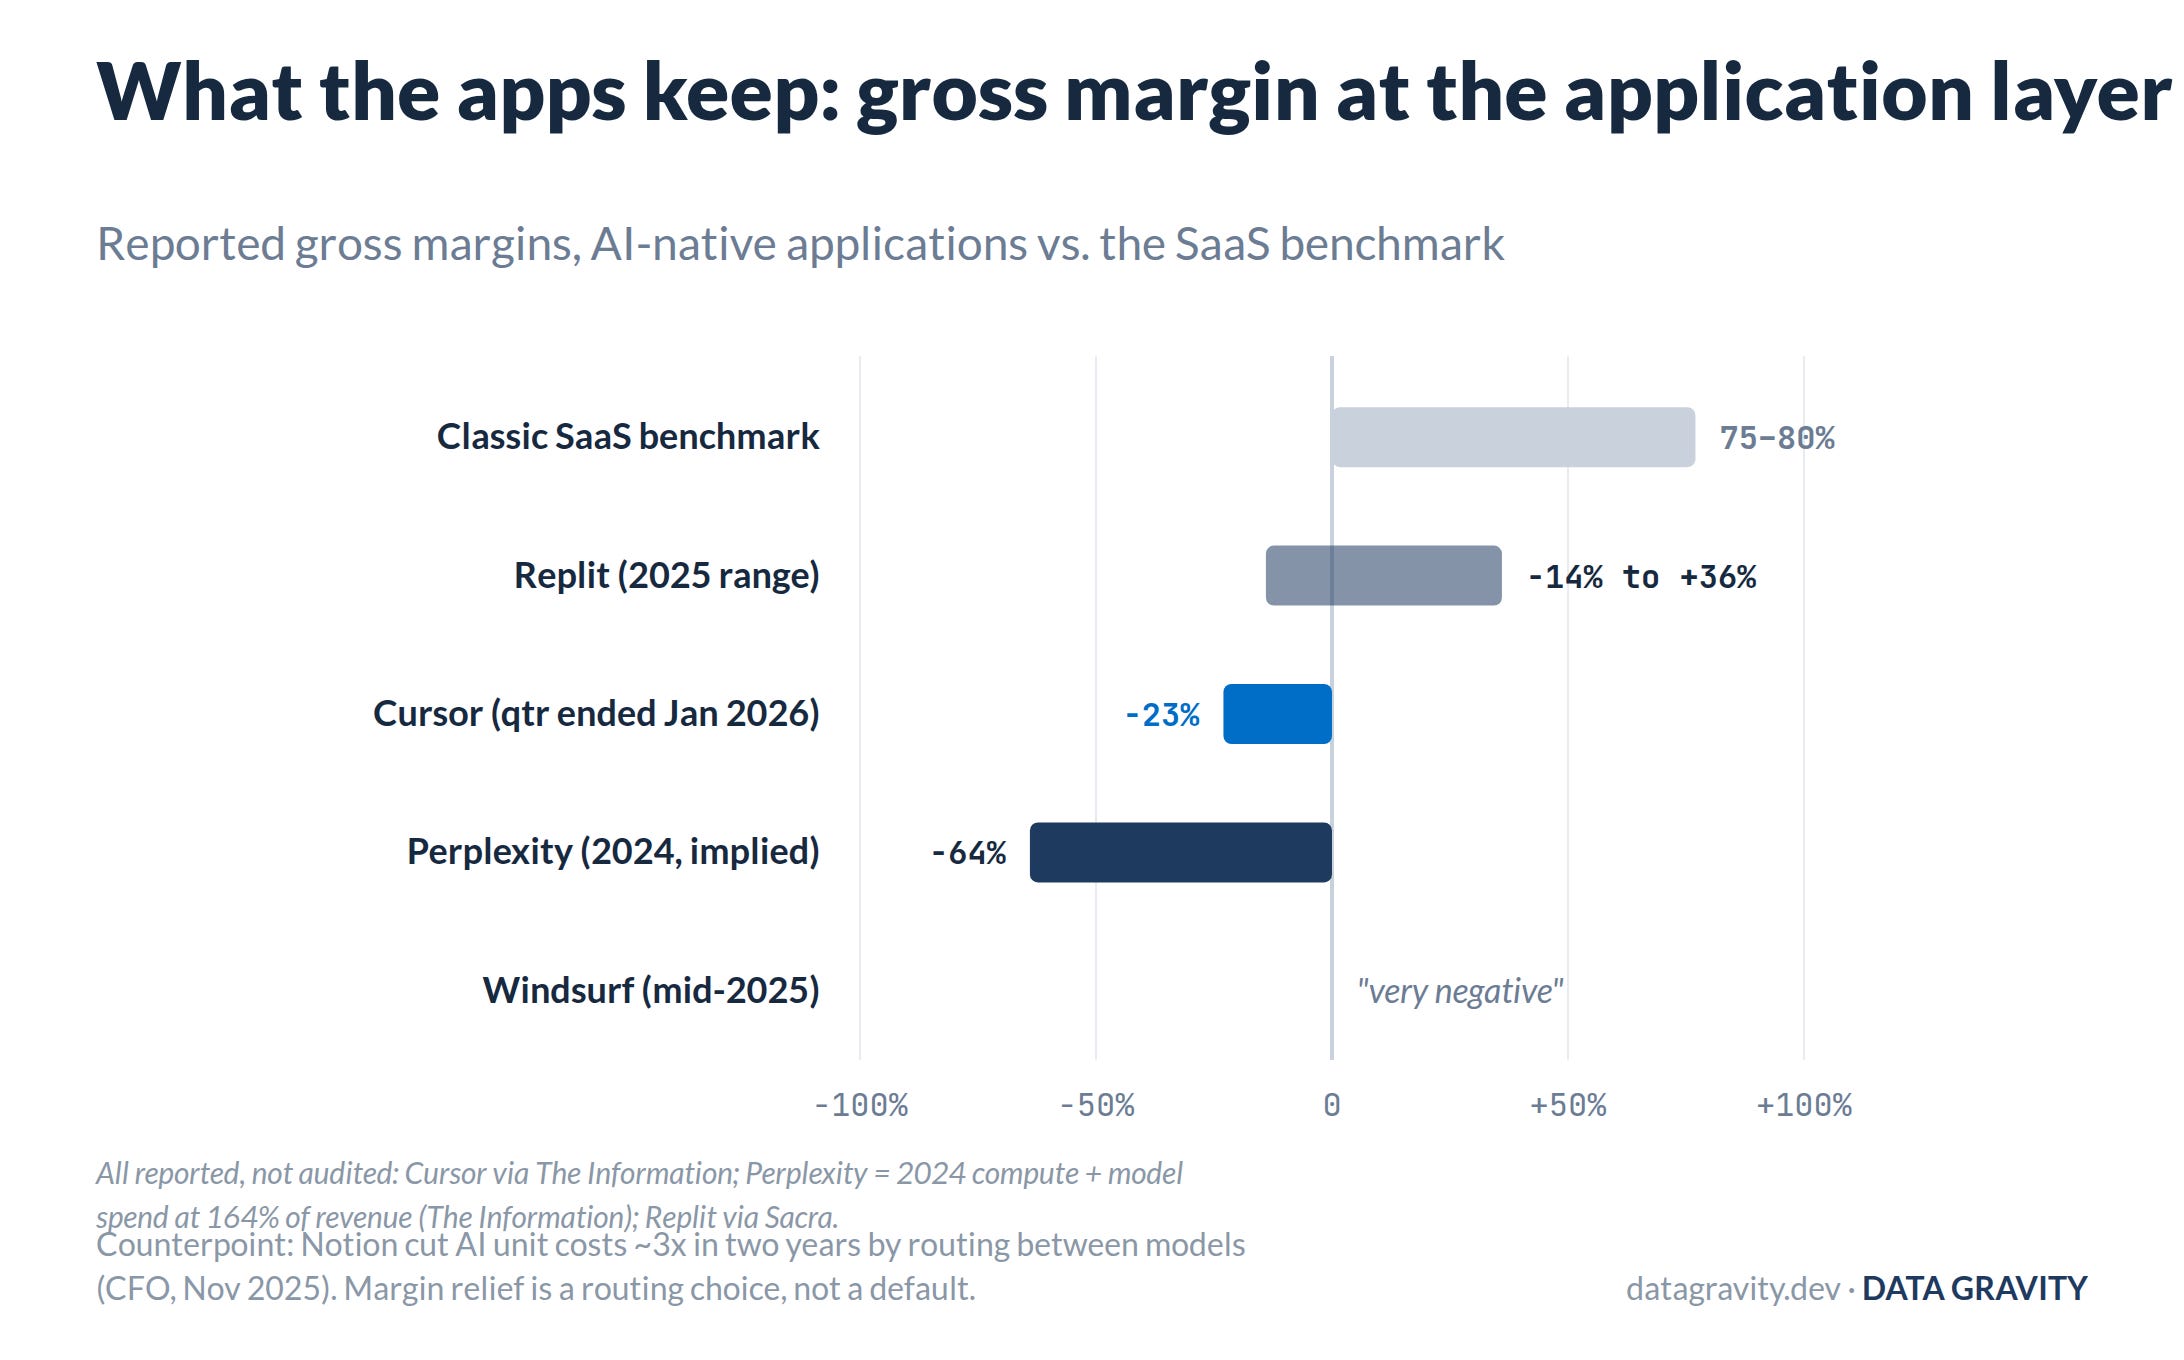
Reported gross margins across AI-native applications against the SaaS benchmark. Every figure press-reported; none audited.
Hyperscalers: Volume Wins, Capex Is Forever
The July-August 2026 reports gave the buildout its best quarter yet. Azure grew 43% and crossed $100 billion in annual revenue; AWS accelerated to 37%, its fastest in eighteen quarters; Google Cloud grew 82%. The demand is contractual, not narrative: Microsoft RPO $678 billion (up 84%), AWS backlog $496 billion, Google Cloud backlog $514 billion. That is $1.7 trillion of signed, unrecognized demand, and all three said the same thing in the same season: demand exceeds supply. Jassy: AWS “will still not have enough capacity to meet all the demand” in 2026. Zuckerberg: Meta is fielding offers for its compute “at a significant premium.”
Cheaper inference is exactly what a hyperscaler wants. A cloud sells utilization, not tokens, and every cost decline widens the set of workloads that clear on its infrastructure. The math that squeezes the labs works for the cloud. Below it, the neocloud tier splits on the same test as every other layer. Bare GPU rental, meaning spot capacity with no software and debt against the depreciating asset, is where falling compute prices land first, and the prior piece scored it weakest in the stack. The version that earns its way out looks different: contracted demand with prepayments, disciplined hardware refresh, and optimization software that captures part of the efficiency it creates. A 10x-cheaper world sharpens that split. It does not sink the whole tier.
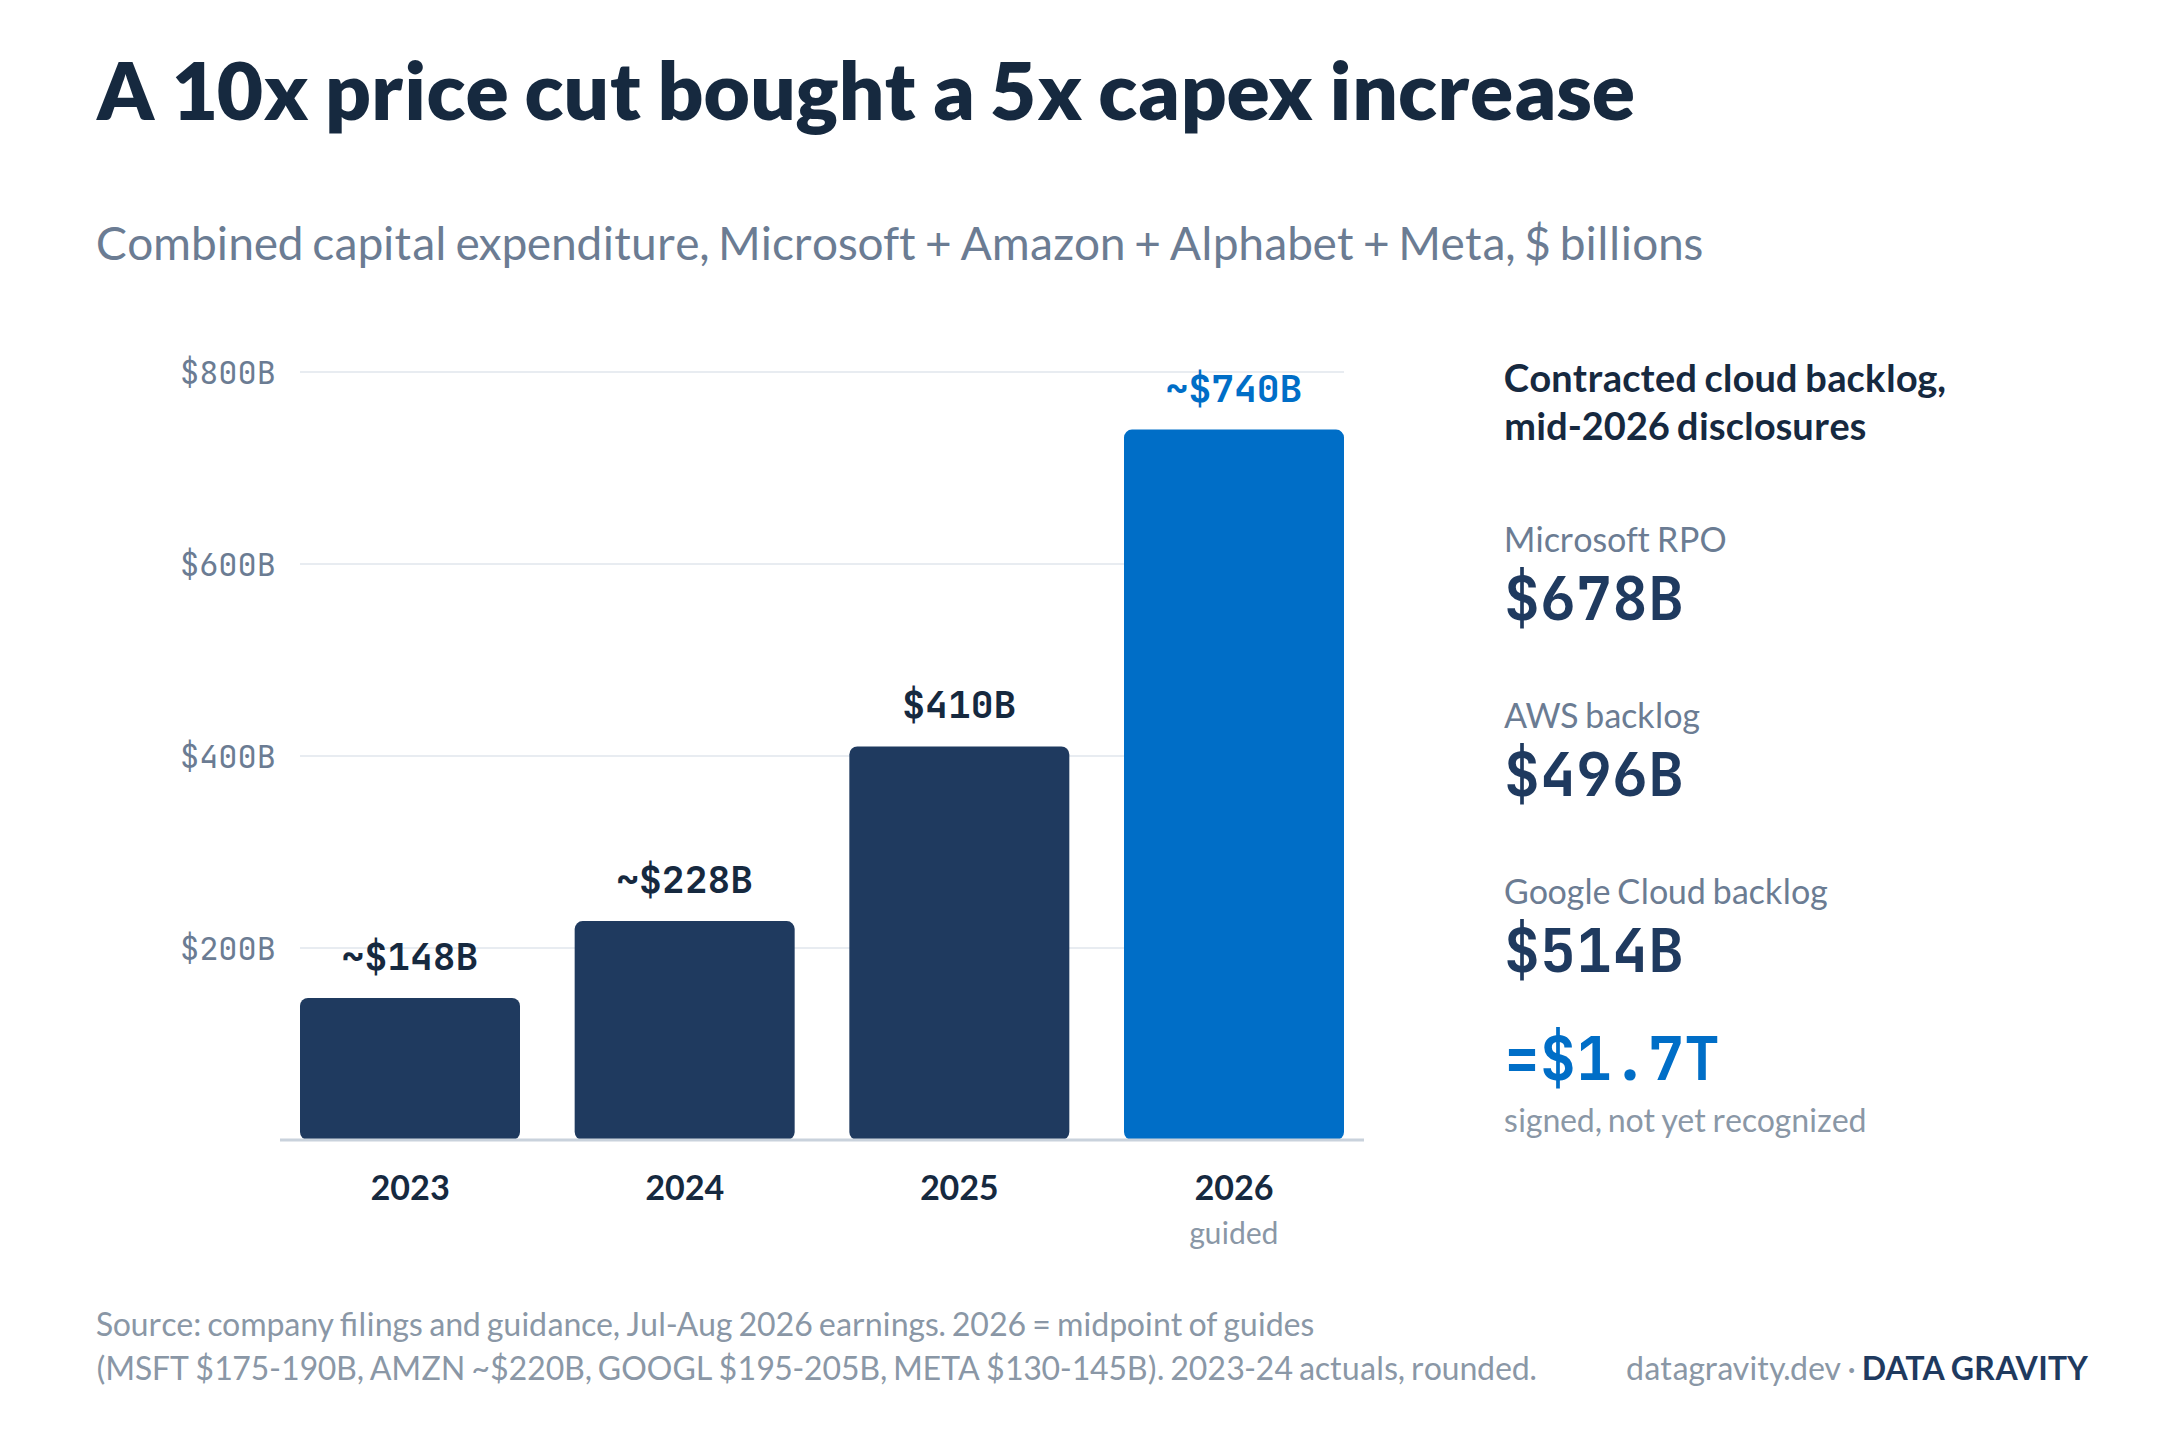
Combined Big Four capital expenditure, 2023-2026 guidance, with mid-2026 backlog disclosures.
The bill showed up one line lower in the same filings. Alphabet posted the first negative free-cash-flow quarter in its history (-$5.9 billion) while raising capex guidance twice, to $195-205 billion. Amazon’s trailing-twelve-month FCF swung from +$18.2 billion to -$7.6 billion. Meta reported quarterly FCF of $784 million, added $24.9 billion of new debt, and has suspended buybacks for two straight quarters. Microsoft, the healthiest, saw FCF fall 23%, and it extended its data center accounting life from 15 to 25 years, moving depreciation out of the near-term P&L without moving any cash. Amazon went the opposite way in 2025, shortening AI server life to five years. The two largest capex programs on earth are making opposite depreciation assumptions about the same asset, which tells you how unsettled the economic life of a GPU fleet is.
That disagreement is the question under the whole piece: when cost per token falls 10x per generation, someone owns the depreciation on the old generation, and where that risk sits is as investable a question as where the margin sits. Hyperscalers hold it on their own balance sheets, cushioned by software margins. Neoclouds hold it with debt collateralized by the depreciating asset itself. The labs mostly rent it. Nvidia manufactures it and books the replacement order. Every 10x cut in cost per token is also a 10x question about what the installed base is still worth.
The verdict: volume wins, margins normalize. A hyperscaler in 2020 was a software-margin business with a capex habit; in 2026 it is an industrial with a software attach. Cheaper inference raises the return on every installed watt and guarantees the watt count keeps compounding.
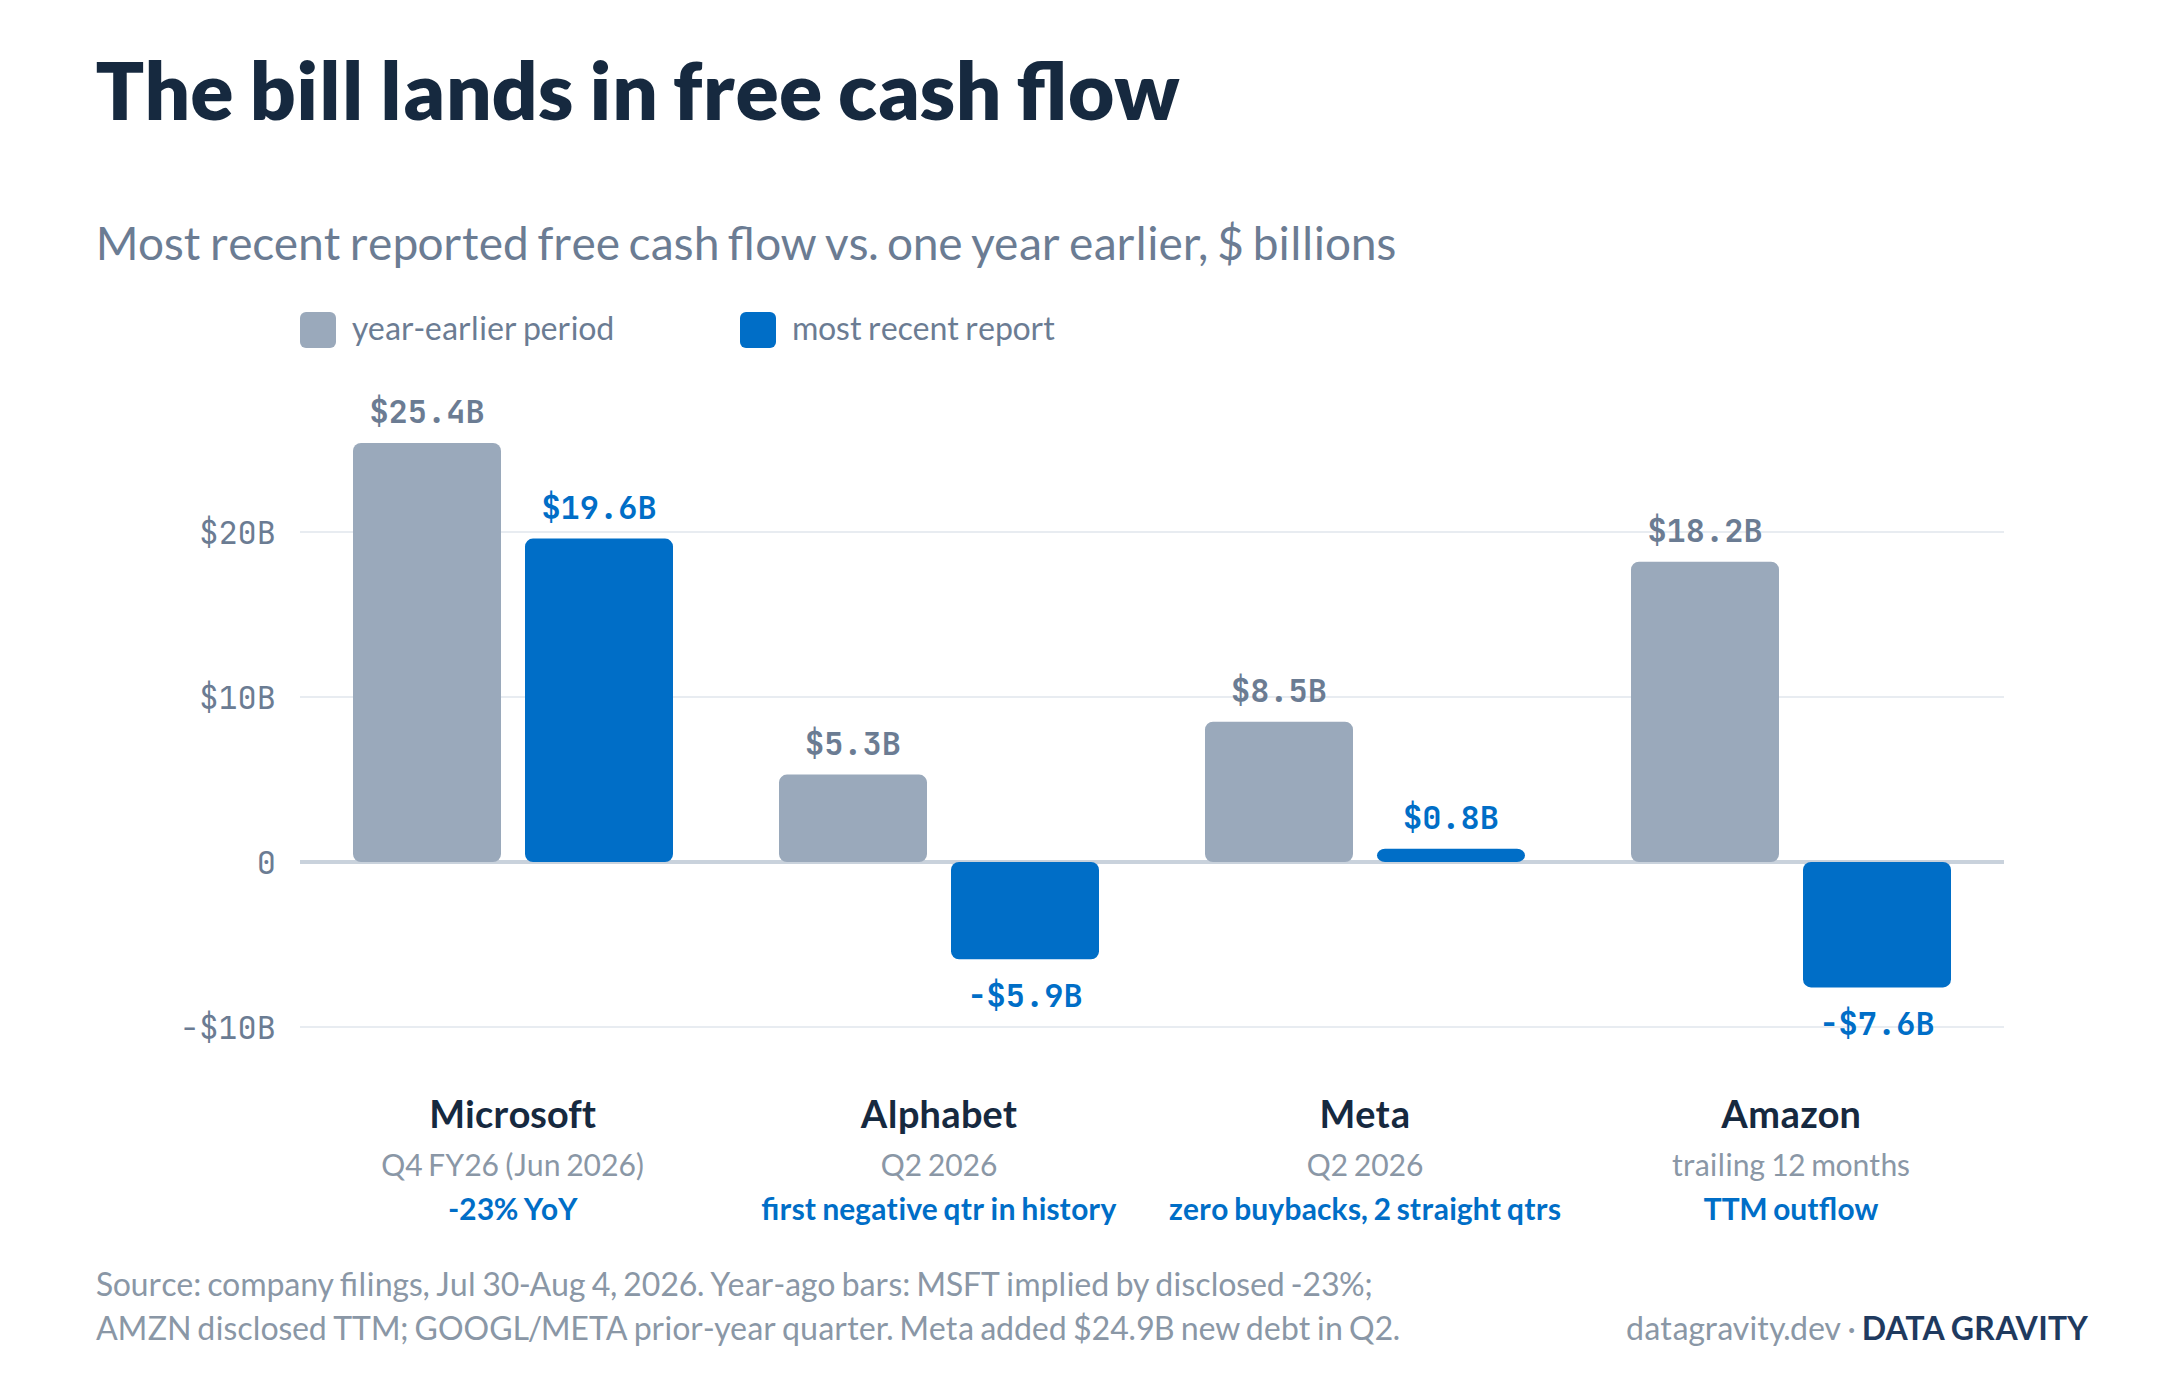
Most recent reported free cash flow against the year-earlier period. The demand story and the cash squeeze are the same story.
Semiconductors: Selling the Deflation
Semiconductors hold the strangest position in the stack. They are the source of the deflation, and they get paid more every year for manufacturing it. Roughly half the annual price decline is Nvidia’s roadmap executing on schedule. Hopper served a representative MoE model at about $0.20 per million tokens. Blackwell cut that to $0.05-$0.02 in production, with Baseten, Together, Fireworks, and DeepInfra all reporting up to 10x. Rubin, shipping this half, claims another 10x. Jensen Huang, on the May call: “Economics of AI of the future is tokens per dollar. Or dollars per token.” Nvidia sells the denominator.
The result is the least intuitive chart in this piece. The company causing the price collapse disclosed $500 billion of order visibility in October 2025 and “through 2027, at least $1 trillion” five months later, at a 74.9% GAAP gross margin. Deflation at 75 points of margin is not deflation for the vendor. It is the product.
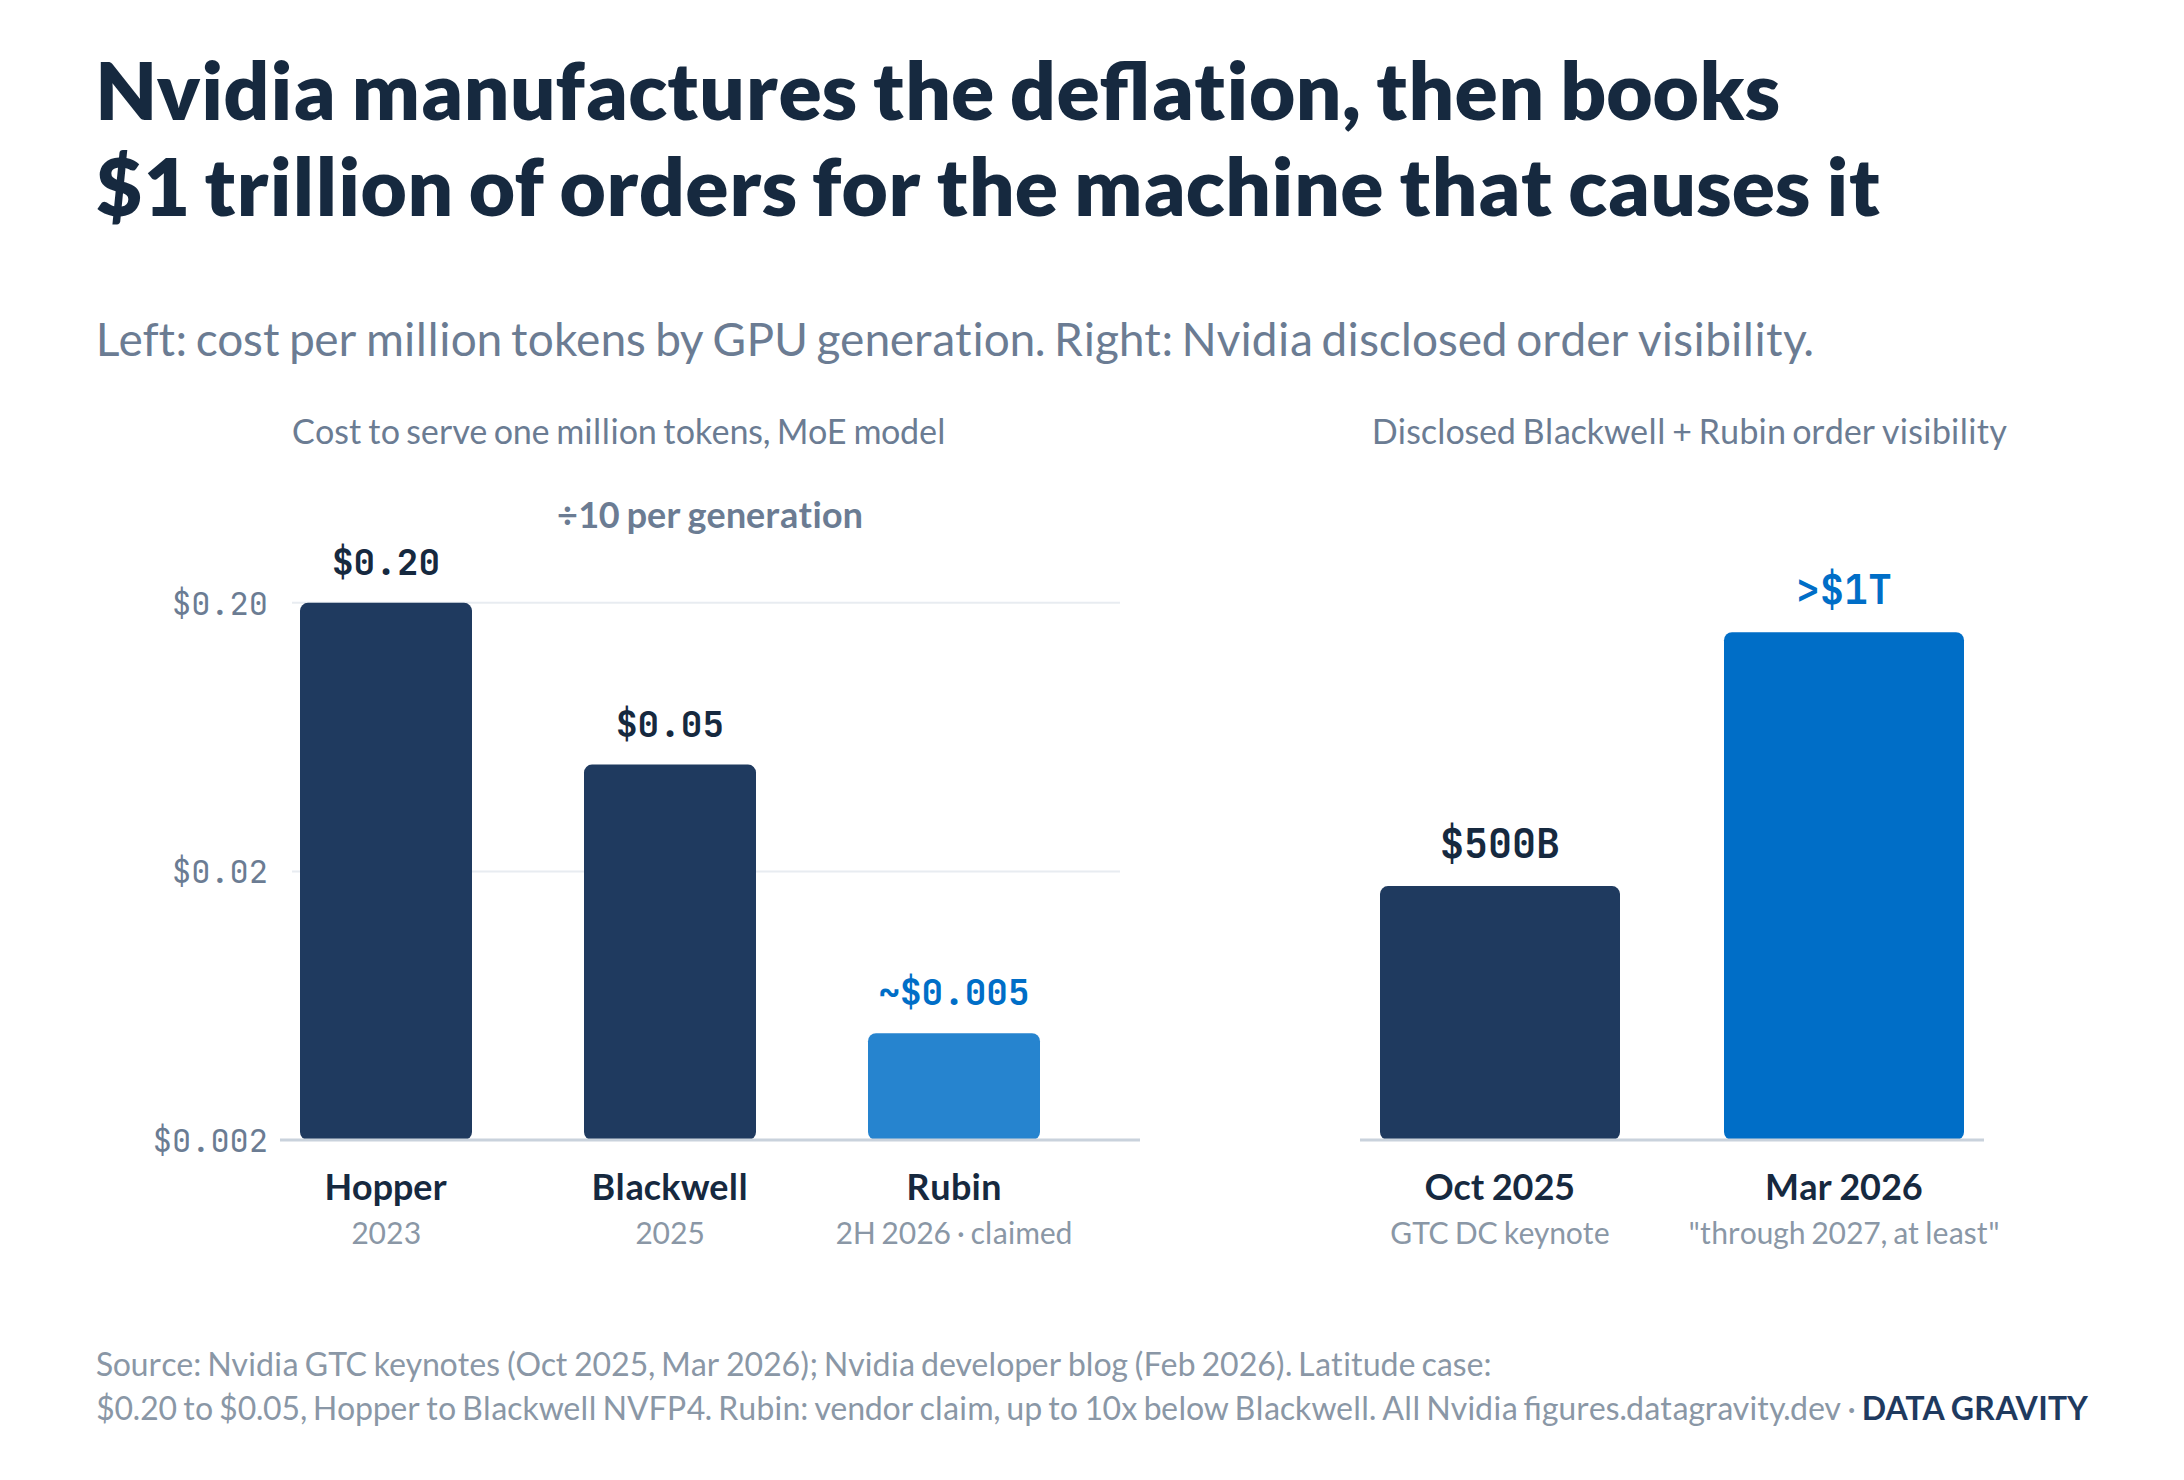
Left: production cost per million tokens by hardware generation. Right: Nvidia’s disclosed order visibility doubled in five months.
One layer down, the foundry collects regardless of whose logo is on the die. TSMC’s June quarter: $40.2 billion of revenue, up 36%, at a record 67.7% gross margin, with CoWoS packaging sold out on 52-78 week lead times. Merchant GPU or custom ASIC, every accelerator in this piece routes through the same fabs. TSMC is the one company for whom the ASIC-versus-Nvidia fight is a rounding error.
The risk to the design layer is share, not demand. Custom ASIC shipments are growing 44.6% in 2026 against 16.1% for merchant GPUs (TrendForce), heading toward roughly 40% of AI servers by 2030, funded by the same four boardrooms that supply most of Nvidia’s revenue. Broadcom booked $30 billion-plus of AI orders in a single quarter and sees $100 billion in 2027; Trainium crossed a $25 billion run rate. Cheaper inference does not shrink the semiconductor pool; units, content per unit, and workload count all rise. It does redistribute the pool toward whoever owns the cost-per-token roadmap, and purpose-built inference silicon is closing that gap faster than it ever did in training.
Memory and Networking: The Complexity Tax
The memory layer taxes what the deflation unleashes. Million-token contexts, reasoning chains, and agents that re-read codebases are memory-bound before they are compute-bound. Context lives in HBM as KV cache and gets re-read at every decode step. The roadmap says so directly: H100 shipped 80GB at 3.35 TB/s in 2022; Rubin ships 288GB of HBM4 at 22 TB/s in 2026. Capacity per GPU rose 3.6x, bandwidth 6.6x, and memory is already about 45% of a Blackwell GPU’s build cost (Epoch AI).
The suppliers print the most extreme numbers in the stack. SK hynix: revenue up 257%, 76% operating margin. Micron: HBM sold out through 2026, gross margins in the 80s. Samsung’s CFO warns constraints get worse in 2027, with new fabs not helping before 2029 or so. Networking rides the same curve with a sturdier margin: Nvidia’s networking segment tripled to $15 billion in a quarter, Arista raised guidance to $12.6 billion with purchase commitments up nearly 3x, and Ethernet optics are on a path to a $100 billion market by 2030 (LightCounting). Arista’s CEO, on components: “the industry is going to have a two-year problem. I don’t think we get out of it as an industry till 2028.”
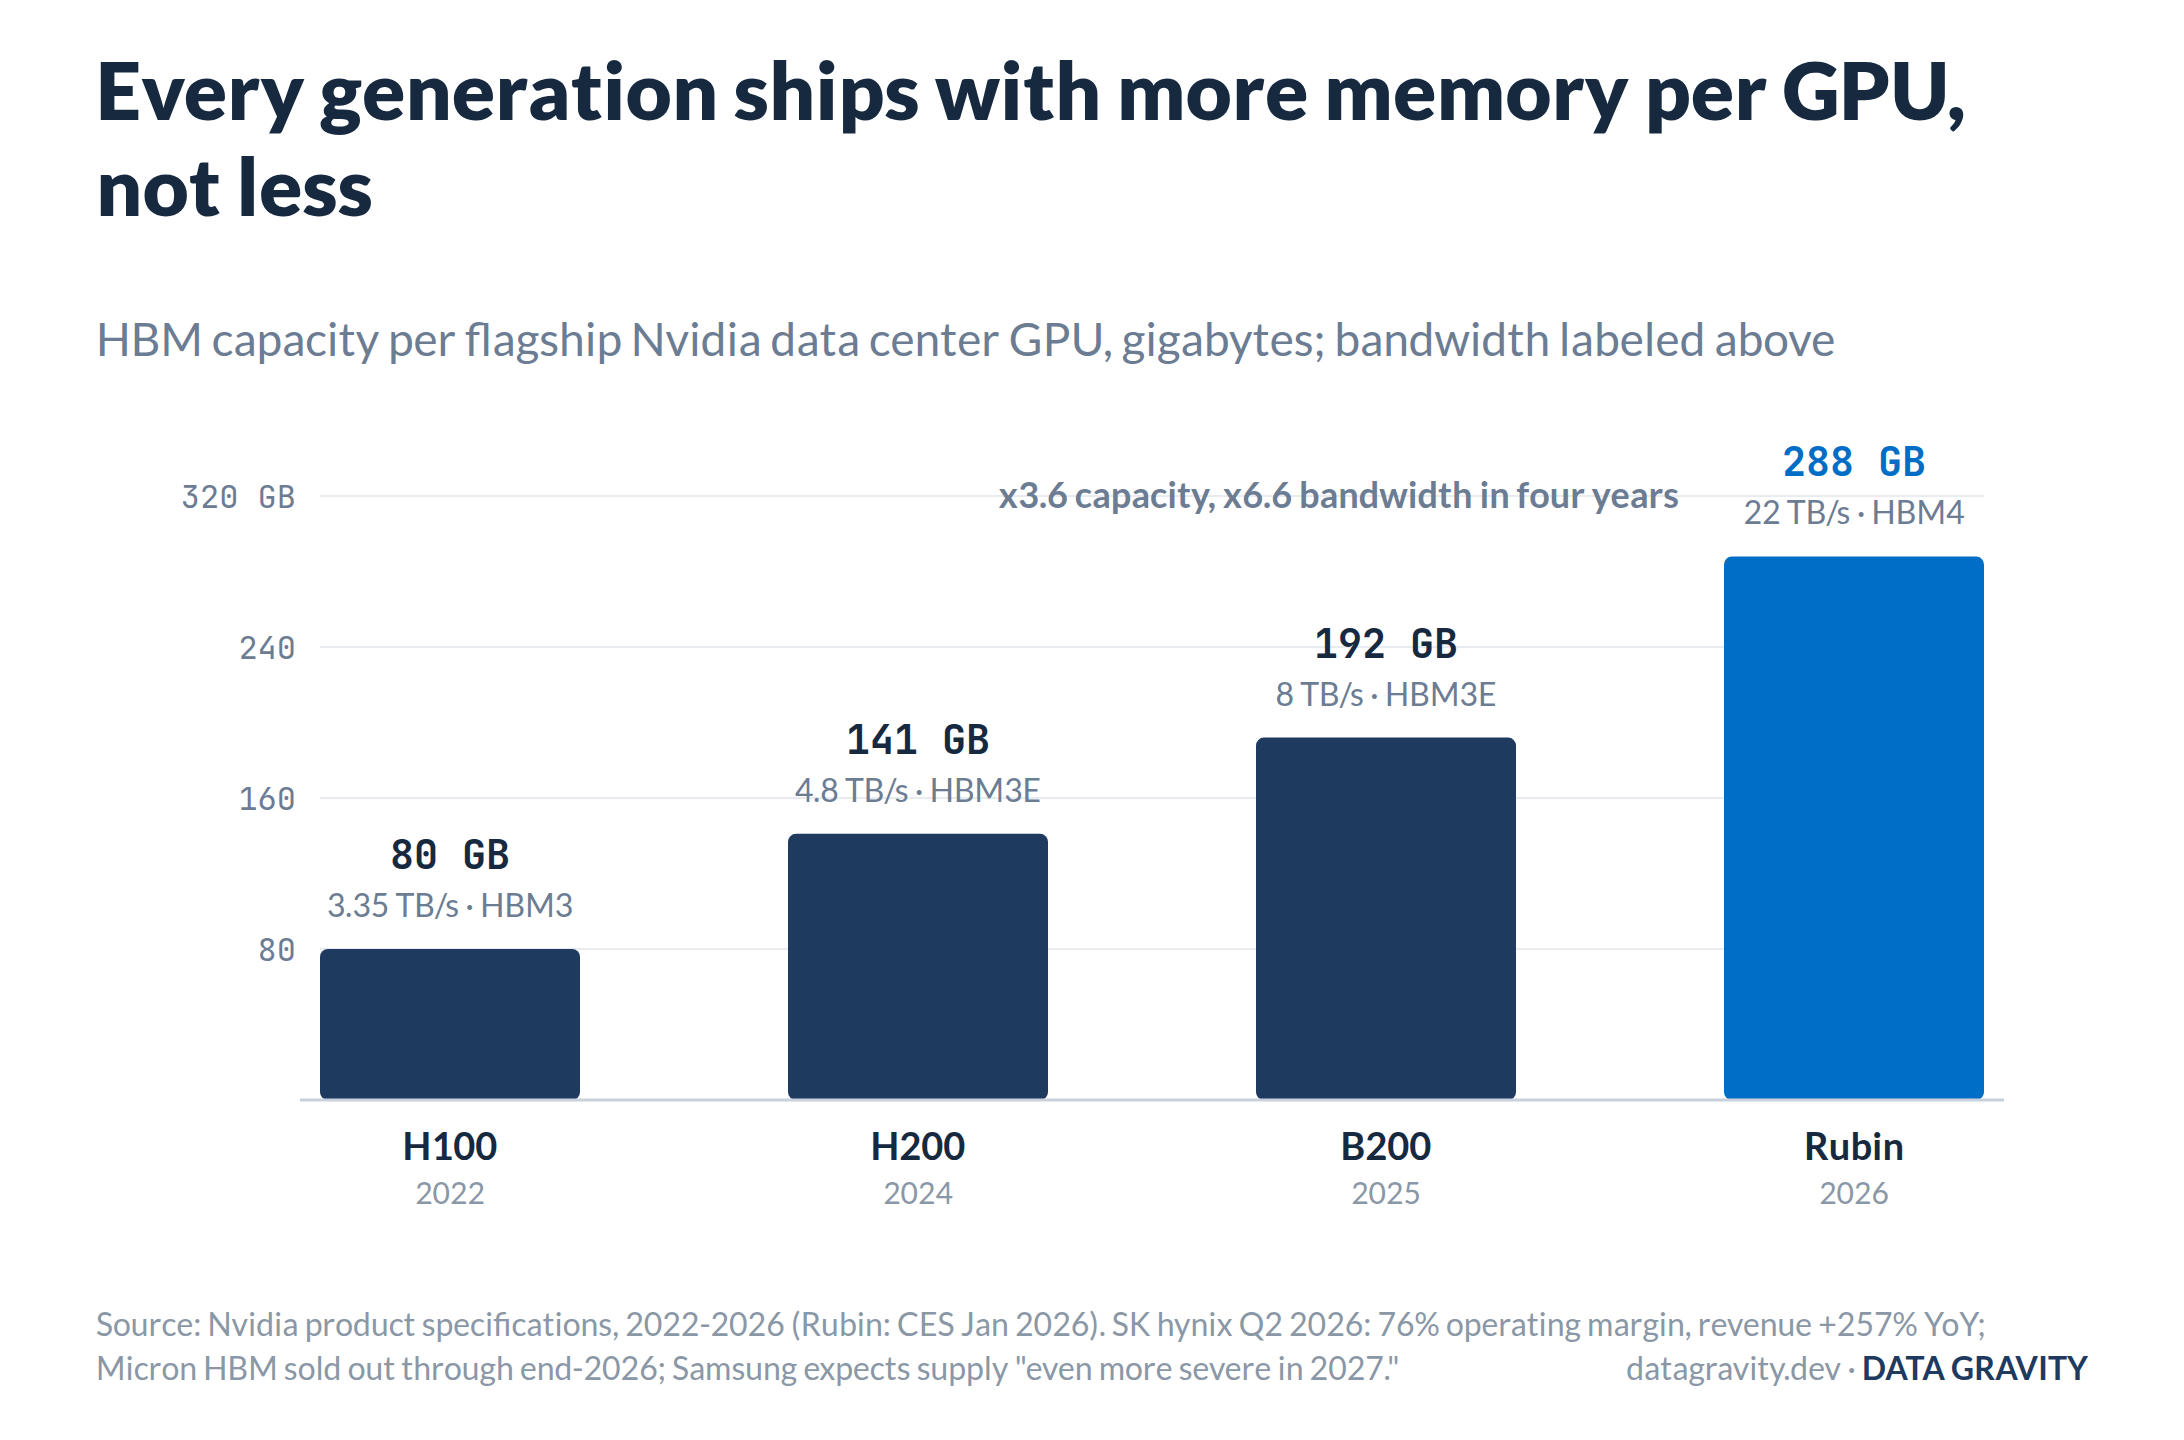
Memory per flagship data center GPU, 2022-2026. The workloads cheap inference enables are memory-bound before they are compute-bound.
The prior piece scored HBM as a cyclical shortage wearing a structural costume, and nothing here revises that. What a 10x decline changes is timing: every added order of magnitude of token demand extends the shortage, and the workload mix is shifting toward exactly the shapes that maximize memory content per unit of compute. Memory stays a trade, not a holding. It is currently the best trade in the stack, set against the strongest base rate in semiconductors: three well-capitalized suppliers adding capacity into 70%+ margins has always, eventually, mean-reverted. HBM has real reasons to run longer than the usual DRAM clock. Packaging qualification, CoWoS coupling, and multi-year hyperscaler contracts all slow the supply response. Longer is not never. Networking is the durable half of the pair: Arista’s 62-64% gross margins sit on software moats and switching costs the memory names do not have, which is why the prior piece scored it overweight while scoring HBM a trade.
Data Centers and Power: The Layer That Never Deflates
Here the pattern inverts. Everything above this layer gets cheaper per unit every year, and watts do not. PJM, the grid operator for the largest data center corridor on earth, cleared capacity at $28.92 per megawatt-day for 2024/25, then $269.92, $329.17, and $333.44, a price that would have hit roughly $530 without the federal cap. The market monitor attributes 46% of the last four auctions’ $63.6 billion cost to data centers (PJM disputes the framing in part). Northern Virginia vacancy is 0.3% with rents roughly doubled since 2022. GE Vernova’s turbine backlog and reservations: 116 GW, sold out into 2031. The scarce input under a 10x-cheaper token is not silicon. It is the interconnection queue, where the median project waits more than five years.
Google supplied both sides of the efficiency argument at this layer. Energy per median Gemini prompt fell 33x in twelve months, to 0.24 Wh, a real engineering feat. Total Google electricity rose 37% in 2025 anyway, to about 3.5x its 2019 level, with the largest emissions increase the company has ever reported. Per-unit efficiency times volume growth equals a bigger bill. It is the same arithmetic Jevons ran on British coal in 1865, now with quarterly disclosure.
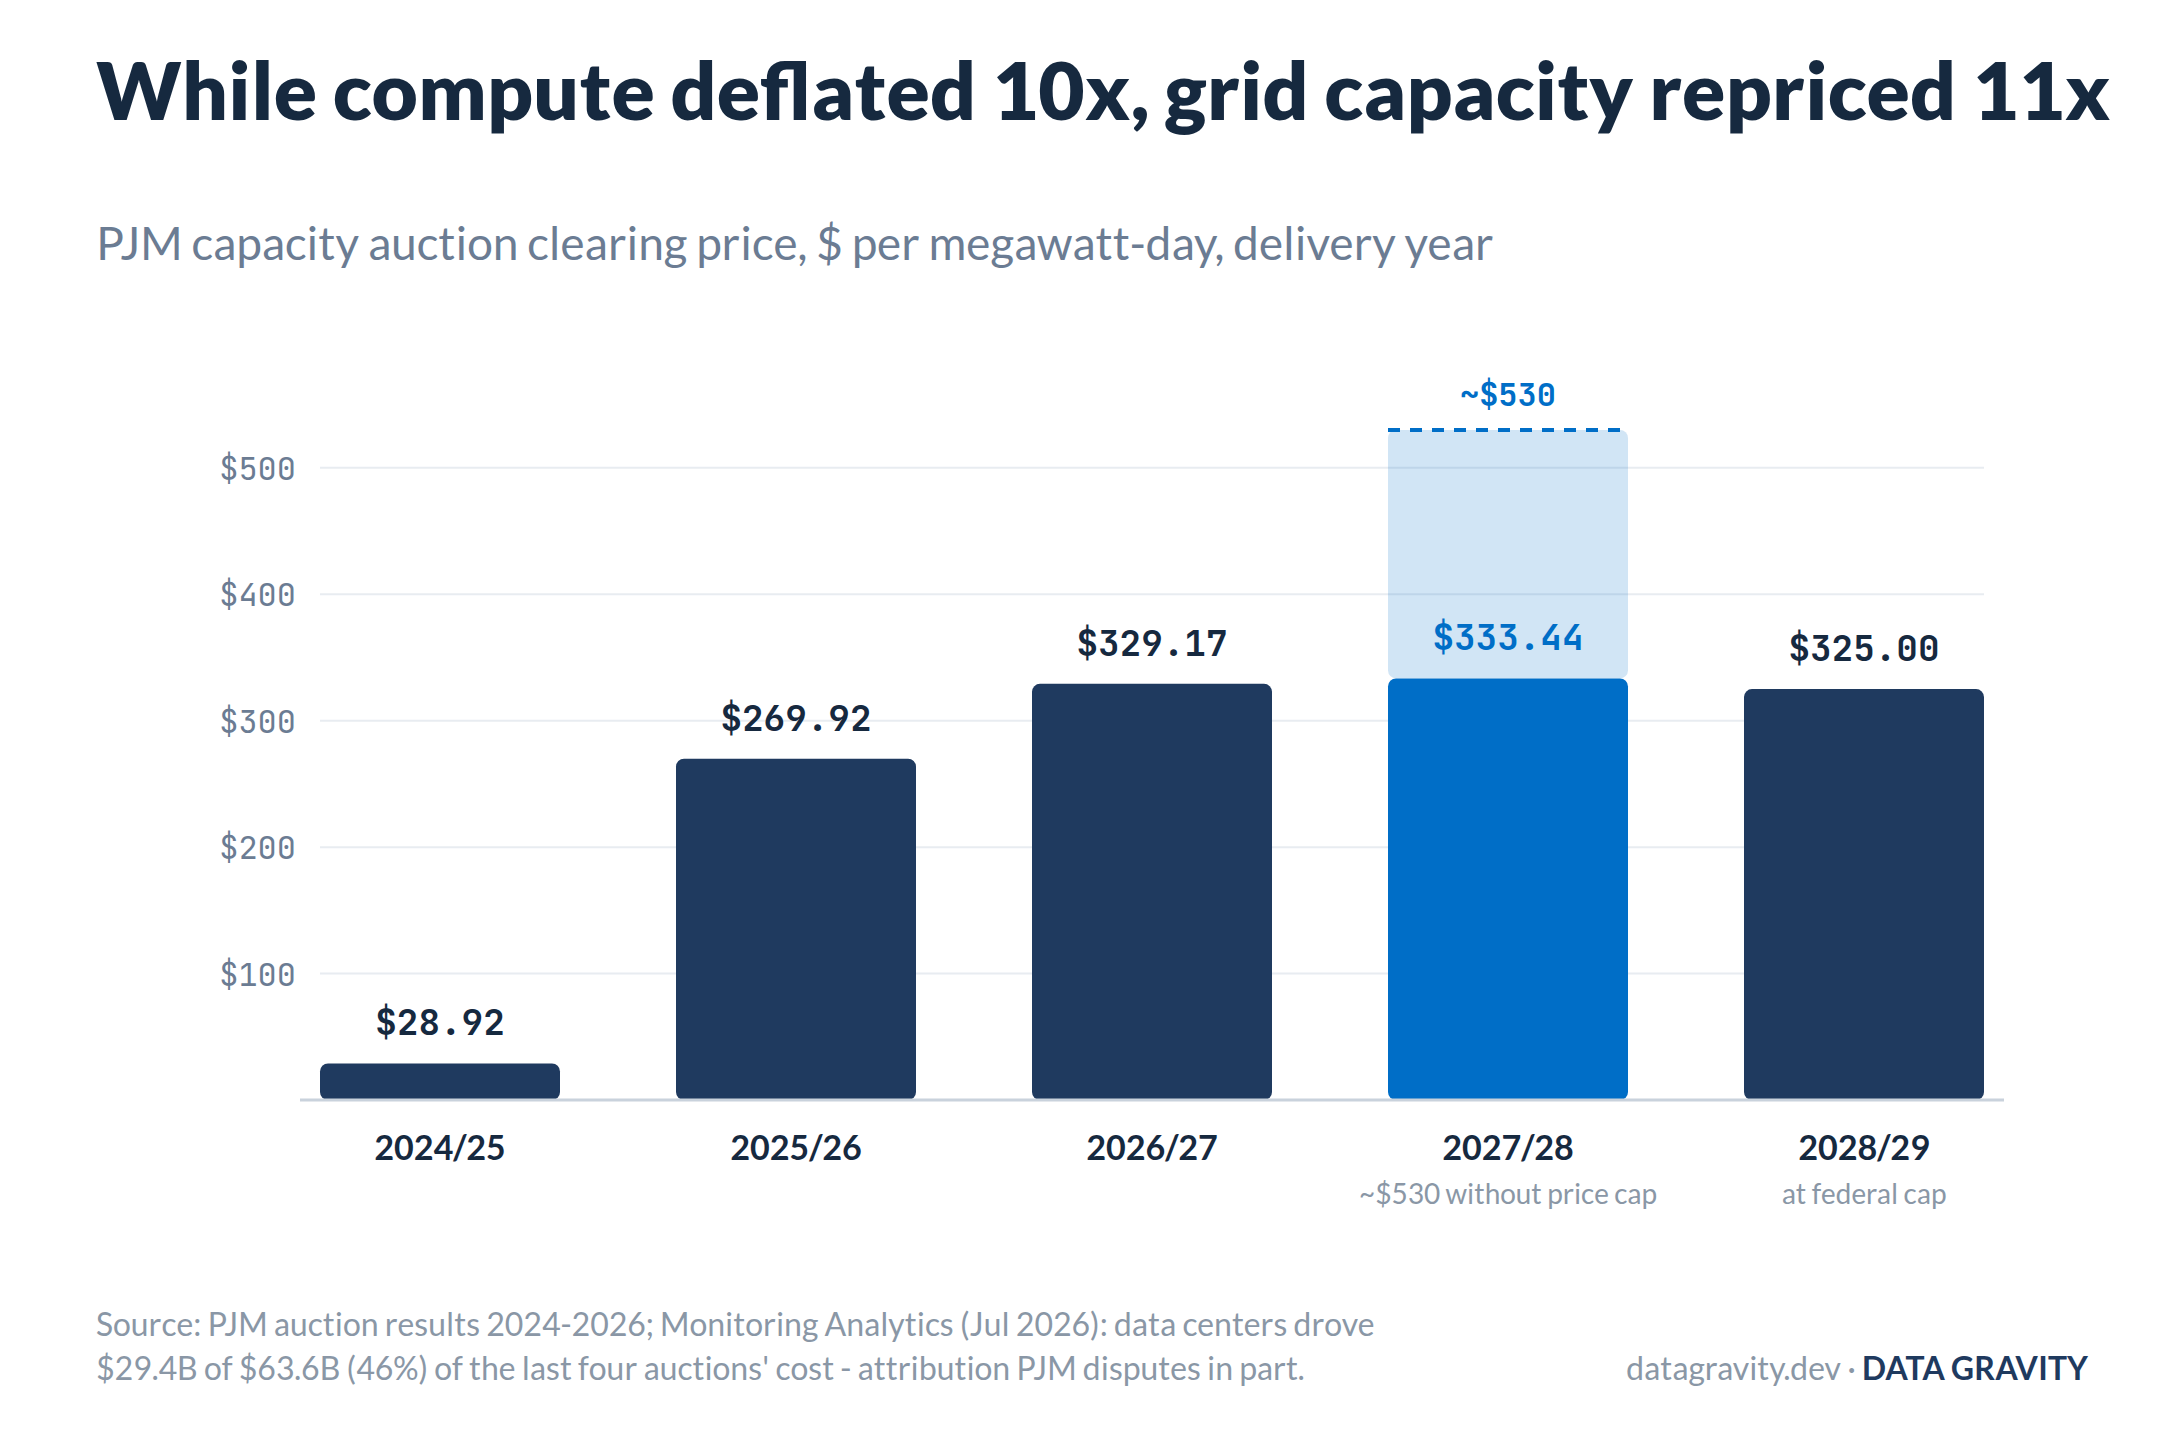
PJM capacity clearing prices by delivery year. Compute deflated 10x over the same window; grid capacity repriced 11x the other way.
This is the cleanest structural read in the piece: power is the only layer where unit prices are rising, across capacity auctions, colocation rents, turbine lead times, and PPA strikes, while everything above it deflates. The precise version of the claim: scarce capacity in the markets where AI demand concentrates has repriced dramatically, while less-stressed grids have not, a limit What Breaks the Thesis takes up. Goldman has U.S. data center power demand going from 31 GW in 2025 to 66 GW in 2027. The IEA has global data center electricity nearly doubling to 945 TWh by 2030. Hyperscalers have signed roughly 10 GW of nuclear PPAs stretching into the 2040s. Cheaper tokens make all of it bigger, because the binding constraint on token supply is now megawatts. The owners of scarce megawatts are the only participants in this stack with pricing power they did not have to engineer.
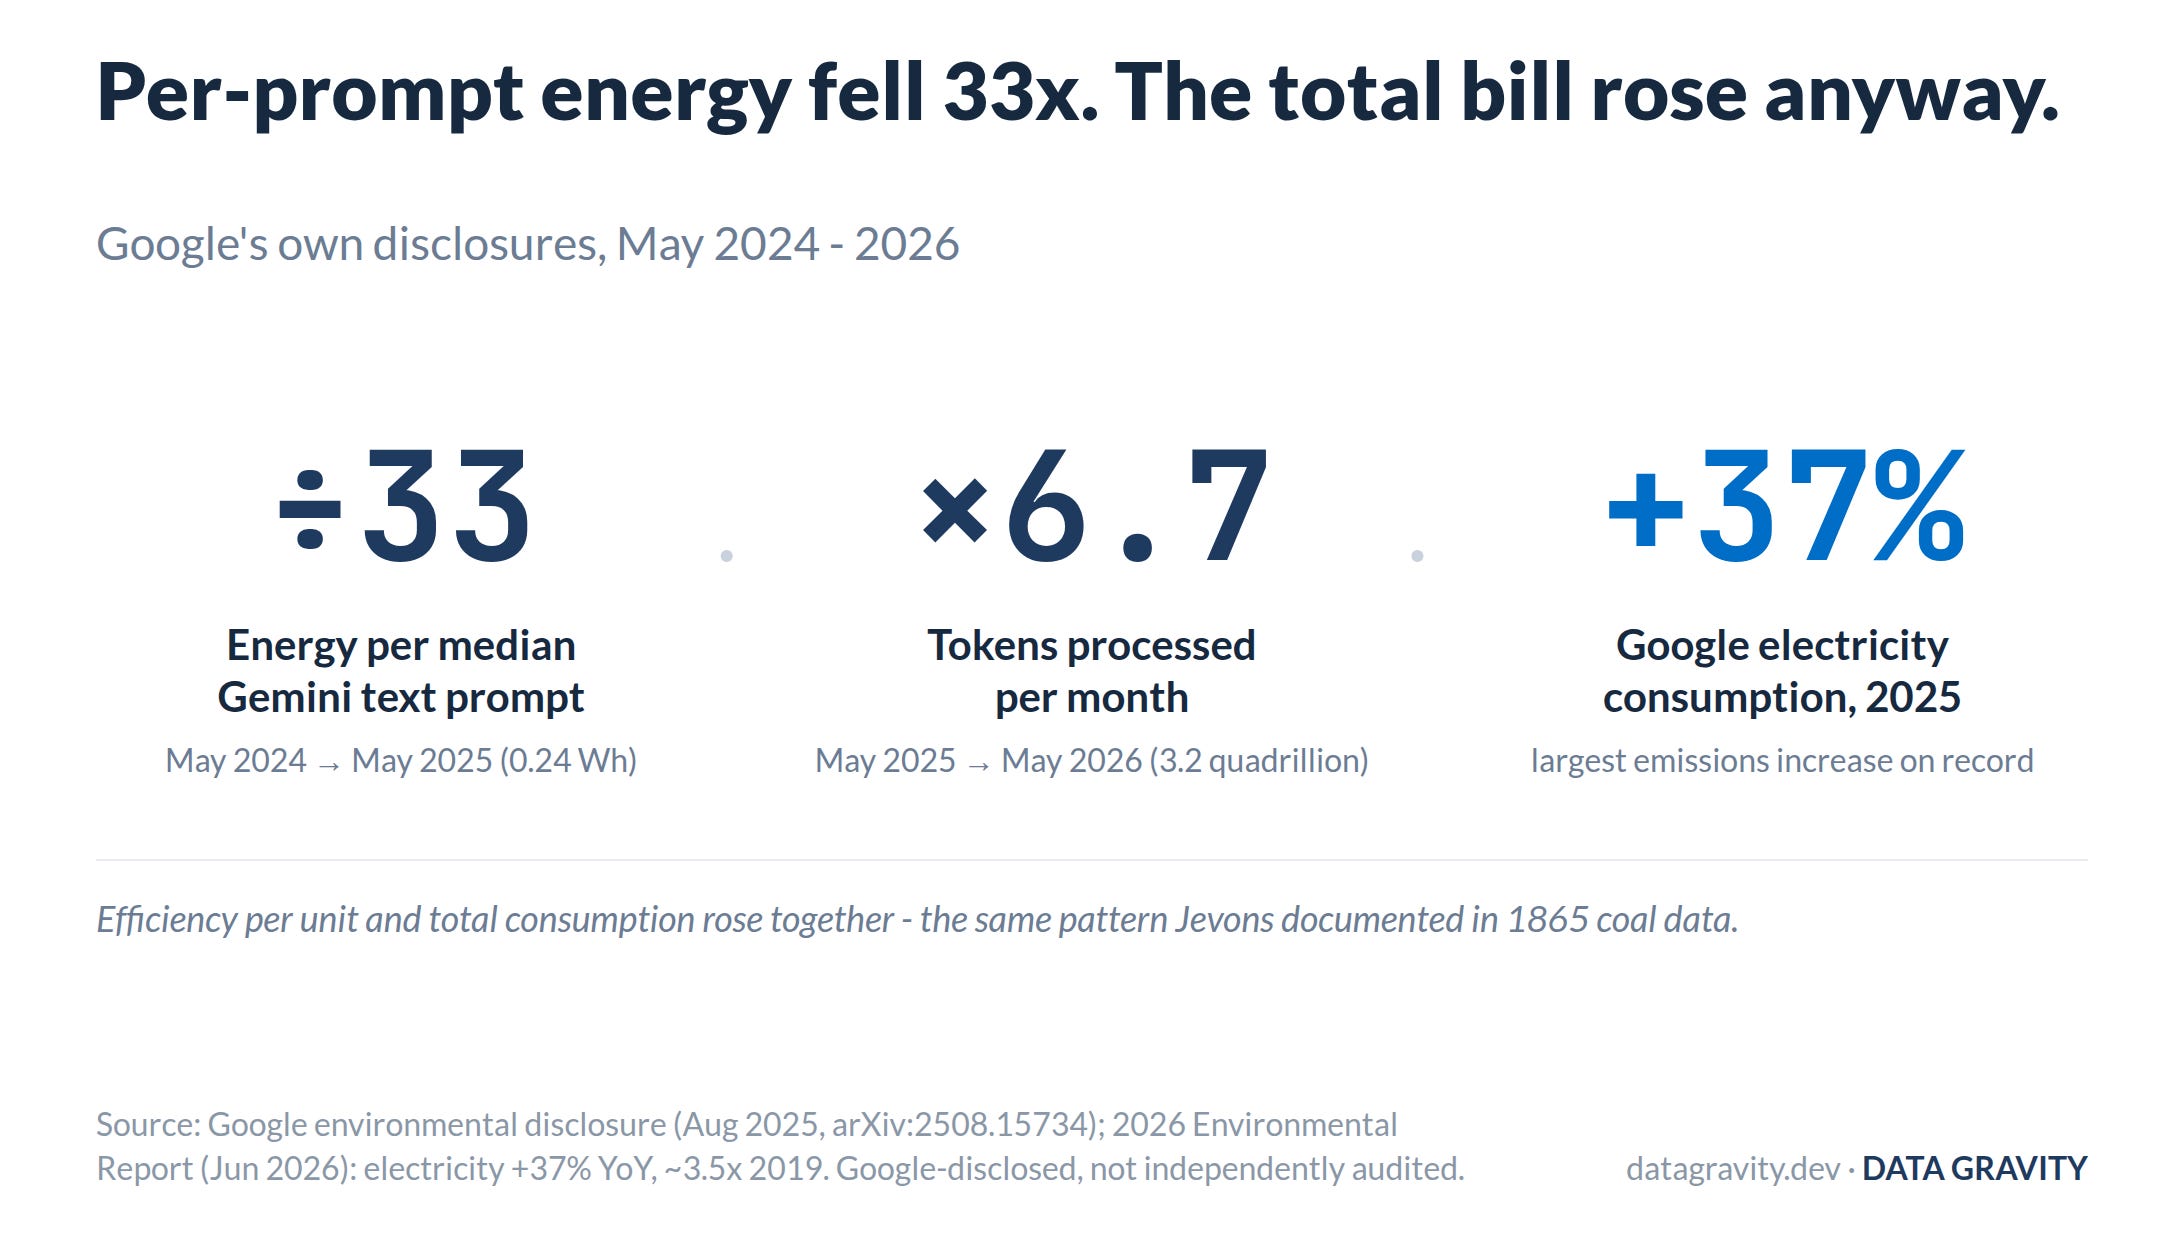
Google’s own disclosures: per-prompt energy down 33x, tokens up 6.7x year over year, total electricity up 37% in 2025.
What Happened the Last Three Times
This is not the first technology to deflate 10x a year into exploding demand, and history is unanimous on the headline: unit deflation has never shrunk the aggregate. Transistor prices fell roughly a billion-fold from 1971 to 2022; industry revenue grew from about $1 billion to $791.7 billion. Real electricity prices fell about 48x across the twentieth century; consumption rose about 630x. IP transit fell from roughly $1,200 per Mbps to under $1, and traffic doubled annually straight through the telecom bust.
The variance worth studying is who kept the money, because the three cases split three ways. In semiconductors, the deflation manufacturers kept it (Intel, then TSMC and Nvidia) because making the next cheap unit was itself the monopoly. In bandwidth, the infrastructure owners kept nothing. WorldCom and Global Crossing went bankrupt on correct demand forecasts, and value moved up to the applications built on cheap bits: Google, Netflix, AWS. In electricity, no one kept outsized margins for long; regulators converted utilities into rate-of-return businesses and the surplus flowed to everything electrified. Deflation always sorts the layers. Which layer wins depends on where the hardest-to-copy scarcity sits.
Three technologies whose unit prices collapsed. The aggregate never shrank; the winning layer differed each time.
So Does Value Migrate Up the Stack?
Map those three endings onto this stack and the headline question stops being binary. The bandwidth ending, where infrastructure commoditizes and applications capture, applies selectively: it is the likely fate of undifferentiated GPU rental and API resale, which is why the neocloud tier already trades the way it does. The semiconductor ending applies where making the next unit of deflation is itself the moat: Nvidia’s roadmap, TSMC’s process lead, the HBM oligopoly while the shortage holds. The electricity ending is roughly where hyperscalers converge: steady, capacity-constrained, utility-like returns. The difference is that nobody regulates PJM prices down to a rate base, which is why power keeps the only rising unit prices in the stack.
Value migrates toward both ends of the stack, and within every layer it migrates away from the undifferentiated version of the business. Up, toward applications that own customers and price outcomes; a 90% COGS decline lands there as gross profit, if tokens-per-task and frontier dependence do not eat it first. Down, past the deflating compute layer, toward watts, land, and interconnection queues no roadmap can 10x. The compression is not a place in the stack; it is a business model. Token resale, GPU rental without software, and thin wrappers on someone else’s frontier model make less wherever they sit. An outcome-priced app, a moated switch vendor, and a scarce-megawatt owner make more in the same cycle. The prior piece’s framework survives with one amendment: value capture tracks how replicable a business is; deflation is the speed at which replicability gets tested.
Positioning. As a stance: own the deflation manufacturers (Nvidia, TSMC) and the un-deflatable bottom (power, grid equipment, and scarce-megawatt owners: the Vertiv and GE Vernova layer). Both ends hold pricing power the middle cannot reach. Treat memory as a trade while the shortage holds, since the capacity response is funded and dated, and hold the networking half of that pair, where the moats are software. Underwrite applications on pricing model and routing discipline, not growth rate. Underweight anything whose only product is someone else’s tokens at a markup: bare GPU rental, API resale, and seat-priced wrappers pinned to frontier COGS. A neocloud exits that bucket with contracted demand and software on top of the compute, not with more GPUs. The labs are venture bets on a terminal margin no one has demonstrated. Size them like it.
What Breaks the Thesis
Elasticity below 1 is the honest bear case. Every dollar figure here rests on demand multiplying faster than prices divide. The early counter-evidence: Google’s monthly token additions decelerated 57% between mid and late 2025 (Tunguz), enterprise budgets are moving from experimentation into permanent IT lines where CFOs enforce ROI, and agents are getting more efficient. Anthropic claims up to 65% lower token use on comparable tasks for its newest models. If tokens-per-task stops inflating while prices keep falling, aggregate inference revenue can fall even as usage rises, and $1.7 trillion of backlog converts slower than the depreciation schedules assume. DeepSeek tested this for one quarter. A real efficiency-led shortfall would test it for eight.
The numbers in the middle of this piece are the softest. Lab margins, Cursor’s -23%, Perplexity’s 164%: all reported by The Information or PitchBook, none audited, and both lab run rates are self-stated at funding events. The S-1s on file will replace several of these figures within months; this piece gets updated when they publish. Materially better audited margins would confirm the serving-line turn. Materially worse, and the application layer’s supplier is shakier than it looks. The power argument has the same shape: it leans on PJM, the most stressed grid in the country. Other regions have not repriced 11x, and a fast turbine-and-interconnection response would soften the claim by 2028.
Vendor-claimed hardware economics deserve their asterisks. The 10x-per-generation figure is Nvidia’s number for MoE inference under NVFP4, seconded by clouds with marketing incentives, and Rubin’s claimed 10x is a spec sheet until it ships at fleet scale. If the real generational gain is 3x, the deflation slows and the demand response weakens with it. That would, perversely, strengthen the memory and power arguments while weakening everything else here.
Summary
Inference getting 10x cheaper is the mechanism of this market, not a threat to it. The deflation is manufactured at the silicon layer and sold at 75% gross margin. It passes through hyperscalers, who convert it into $1.7 trillion of contracted backlog and permanently higher capital intensity. It reaches the labs as a treadmill that grew revenue an order of magnitude while blended margins lagged the software benchmark, though serving margins reportedly hit 70% by mid-2026, the first hard evidence the deflation is reaching the labs’ own P&L. And it lands at the application layer as the best input cost curve in software history, capturable by whoever prices outcomes instead of reselling tokens. Underneath it all, the one layer with rising unit prices, power and land and grid capacity, holds the pricing power everyone else has to engineer. Demand has out-multiplied the price decline at every test for four years. History says unit deflation never shrinks the aggregate; it sorts by scarcity. This cycle is sorting the same way, and in every layer the undifferentiated version of the business will make less.
The belief that software margins can perpetually outrun physical decay is a dangerous delusion. Look at the financial gymnastics across hyperscaler balance sheets. When one provider depreciates AI servers over five years while another stretches data center shells across twenty-five, they aren't executing conservative accounting. They're trying to hide the brutal reality of silicon obsolescence under a blanket of delayed amortization. 📉
Tokens aren't abstract mathematical spirits floating through an ethereal cloud. They're kinetic heat dissipated across silicon gates. When inference deflates tenfold every single year, your installed hardware base suffers a violent economic phase change. The trailing GPU doesn't gracefully age into a low-cost utility asset. It hits a non-negotiable thermodynamic wall. Running an aging Hopper cluster when newer architectures slash watts per token by an order of magnitude burns more operational cash in raw substation power than the salvaged silicon is worth on the secondary market. ⚡
Here is the core law governing this entire cycle: as the marginal price of syntactic computation approaches zero, economic surplus undergoes complete phase condensation into the lowest-frequency physical invariants. The value doesn't evaporate into algorithmic cleverness. It pools violently at the bedrock where nature enforces its strict tollgates. You can't write a software update that compresses a five-year substation interconnection queue. You can't prompt-engineer your way around a 700-watt thermal flux density across a reticle-limited die. 🏛️
The genuine margin shock won't arrive from model labs undercutting each other on raw API endpoints. It happens the moment trailing GPU fleets face catastrophic un-fungibility. An old cluster locked into single-tenant debt cannot be magically repointed when reasoning models demand 288 gigabytes of HBM4 bandwidth simply to prevent memory-bus starvation. The players treating compute as a financial abstraction will wake up owning dead silicon, while the entities anchored directly to energized megawatts and non-invertible physical pipelines capture the entire bounty. 🔌
If trailing silicon cannot out-earn its own kilowatt draw against next-gen optical and low-precision architectures, at what exact amortization quarter does your legacy GPU debt trigger a balance-sheet insolvency event?
(•̀ᴗ•́)و ̑̑
Chris — with the help of AI- This is the strongest version of this argument I’ve read, and the organizing idea is right- deflation doesn’t move value up or down the stack so much as toward whatever can’t be deflated. The frontier-versus-trailing distinction is what makes it work, and I think it carries more weight than the elasticity section does. Enterprises upgrading within months while open-model share falls despite the price advantage is the cleanest evidence in the piece.
Where I’d push is the hyperscaler verdict. “Industrial with a software attach,” converging on utility-like returns, doesn’t match what the June quarter printed. Google Cloud did $8.8B of operating income on $24.8B — a 35.6% margin, against $2.8B a year earlier. AWS did $16.6B on $42.2B, a 39.4% margin, up from $10.2B, and it earns that on a five-year server life while Alphabet runs six, so it’s the more conservative number rather than the flattered one. Utilities don’t expand segment margins fifteen points in a year.
The honest counter to my own point is that depreciation lags placement in service. Alphabet spent $44.9B of capex in the quarter against a $195–205B guide, and almost none of that vintage is in D&A yet, so Microsoft’s compressing cloud margin might be the leading indicator rather than the laggard. Both readings fit the same prints. Which is why the dashboard I’d want isn’t an elasticity proxy at all — it’s segment D&A growth against segment revenue growth. That settles your utility question within a year instead of by argument.
On the depreciation question you raise three times and leave open: I think it resolves on fungibility. Cheap trailing-capability inference is itself a growing market, so depreciated silicon has demand waiting for it. The risk sits with whoever can’t re-point a fleet — single-tenant leveraged rental first, and arguably single-customer ASIC deployments, which have a thinner secondary market than merchant silicon in a hyperscaler’s utilization pool. Sharper version of your neocloud verdict, and it cuts slightly against the ASIC enthusiasm elsewhere in the piece.
Two sourcing notes, kindly meant. Nvidia’s $1T is forward visibility through 2027, not disclosed orders — the $500B was the figure with purchase-order language attached. And the Microsoft 15-to-25-year extension covers shells and buildings; servers are a separate class that went four to six. Against Amazon’s five-year AI servers it reads as a twenty-year disagreement about GPUs, when the truer point is better for you anyway: hyperscalers own both ends of your barbell on one balance sheet. TY!